Here’s a fun rabbit hole to tumble down: Google “How much data is there in the world” and wind through the results. The Daily Mail frames an answer nicely in an article that’s well over a year old now: “There is so much data stored in the world that we may run out of ways to quantify it.”
Another article that comes up from Phys.org states that: “… humankind is able to store at least 295 exabytes of information. (Yes, that’s a number with 20 zeroes in it.) … Put another way, if a single star is a bit of information, that’s a galaxy of information for every person in the world.”
While the massiveness of all this data boggles the mind with ease, the granularity of it is equally staggering when you consider the individual sources of the stuff. Every interaction that every user has with any piece of technology produces more of it, and as people are becoming more comfortable using technology and more reliant on the information it provides, they want to use more of that data in simple and rewarding ways.
“Data is probably the most intimidating type of content for most end-users outside of analysts to engage with,” says Quinton Alsbury, Co-Founder and President of Product Innovation at Roambi, the winner of the Design for Experience award in Bringing Order to Big Data. “Providing users with a simple and engaging experience that presents the information in an aesthetically pleasant way—and that helps guide them through how they should interpret it via a highly interactive UI—can dramatically improve their confidence. Very often, you find that once this ‘a-ha!’ moment happens for users, they begin clamoring for more and more information.”
To provide users with more of those “a-ha” moments, Roambi has designed an interface that makes it easier to understand and explore their data, building a level of comfort that allows them to incrementally process more sophisticated data. Naturally, the proliferation of mobile devices has played a big part in how Roambi has developed their solutions.
“Mobile devices themselves are becoming the primary access point for information because it can be leveraged by users in the moment and in context,” Alsbury says. “We designed and built Roambi explicitly to provide that instant, highly interactive, mobile-centric experience, which affects everything that we do in the product and will continue to build for the inevitable mobile future.”
As more mobile devices enter the world, they generate more and more data that needs to be understood, analyzed, presented, and consumed. So, while Roambi is trying to provide a rewarding data experience on mobile devices, they are also designing in response to the continued data boom.
“We think of data as content, no different than classic unstructured formats like video, images, copy, etc.,” says Alsbury. “Throughout history, different types of content and the mediums used to capture and present it have dominated the culture both in business and in general. We believe that data is quickly becoming the primary content of the 21st century, so there is a huge opportunity to create the tools and the medium to help people interact with it.”
Data is quickly becoming the primary content of the 21st century
Alsbury notes that advertising and media agencies are building data services divisions to provide their clients with rich experiences of data, right alongside of the classic creative divisions in web, print, and video. “I believe there will be a whole new creative class that forms around taking the massive amounts of data that are being generated, and helping transform it into something that is as easy to engage with as video. Roambi’s ultimate goal is to be the tool set for that new class.”
We Need Smart Data in the Medical Sector
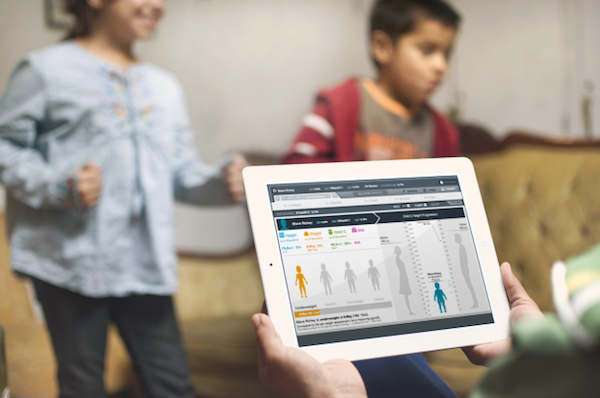
A finalist in the Bringing Order to Big Data category, Fjord created the SMART pediatric growth chart in an effort to change the way that the data for a child’s development is interpreted. What has traditionally amounted to doctors plotting points and extrapolating insights took years of experience to understand and was nearly indecipherable to a parent or non-professional.
A collaborative effort between doctors and designers led to the development of a dashboard that allows practitioners to visualize a child’s developmental health patterns, while also providing parents with a way to more easily understand the health, wellness, and progression of their child. Looking at the massive opportunities to use data intelligently to transform the healthcare industry and health management for people, Fjord points out two big shifts.
- The shift from reactive to proactive treatment of a disease. This can move us from a society that is focused on treating an existing disease to detection and prevention of disease.
- The shift from population-based, lowest common denominator recommendations, to more precise and individualized solutions.
“Healthcare systems, in both emerging and developed nations, are strained by reactive healthcare solutions: it’s a very expensive approach which puts financial burden on people and society, and also reduces people’s quality of life over preventive treatments,” says Fjord’s CEO, Olof Schybergson. “With the ability to harness data—whether genetic, biological, lifestyle, or a combination—we can enable people and their healthcare providers to foresee and prevent the onset of disease and other complications.”
Schybergson points to the Quantified Self movement, which has improved levels of disease detection but notes that, currently, data has not yet allowed us to diagnose and treat disease. “Because of regulations and long-held approaches and practices in the healthcare industry, the move to connecting those three phases is going to be a massive undertaking and will take some time,” Schybergson says. “But, the consumerization of healthcare is well under way. In fact, Dr. Eric Topol, director of the Scripps Translational Science Institute, has said, ‘these days, I’m actually prescribing a lot more apps than I am medications.’”
Making Public Sector Data Pretty
The government has long been a purveyor and collector of data, though it isn’t often presented in compelling ways. BrightPoint Consulting, another finalist in this category, brought some beauty and order to data surrounding the federal budget, political influence, and the U.S. trade deficit through a series of interactive data visualizations.
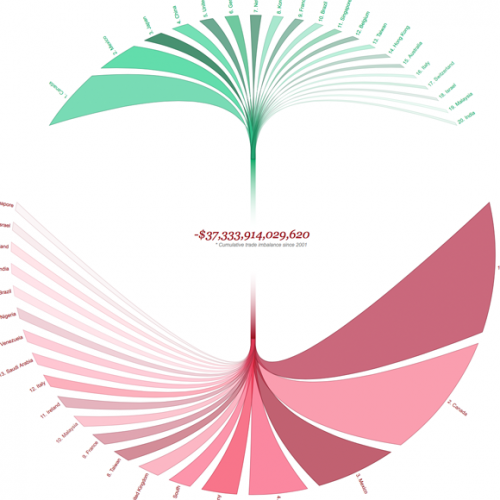
The U.S. Trade Deficit (click for interactive version)
Despite the grace his company was able to bring to these data sets, Managing Director Thomas Gonzalez says he sees the injection of more tracking and analytic products into the consumer market creating more confusion in the public sector, and leading to more customized visualization solutions.
“Each organization has its own specific needs and use for big-data that is often hard to capture and encapsulate in off-the-shelf analytics and tooling,” Gonzalez says, adding that the increased demand for analytics and data visualization in the mobile market means that more companies are looking to take data visualization off the desktop and adapt it to the mobile form-factors. “The increased need for user experience design becomes paramount in not only adapting to the mobile interaction experience but also finding better ways for these new interaction models to empower the user with relevant data.”
Turning Customer Data into Actionable Insight
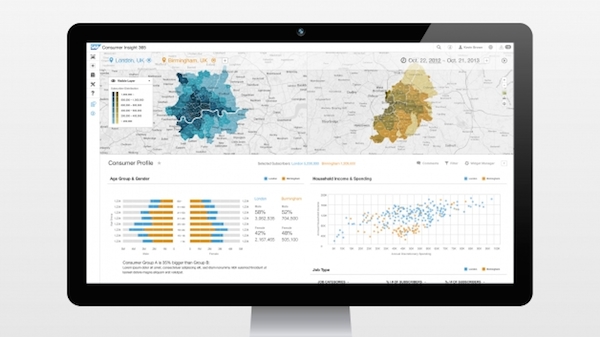
The team at SAP Consumer Insights 365 gathers and aggregates 14 billion data points per day, aggregating customer profile information and transactions of mobile calling and data, which creates the sizable challenge of organizing the data into meaningful structures and visualizations for a professional analyst. The product has had a big impact on the marketing industry, enabling analysts to make insights based off accurate continuous data rather than snapshots, helping enterprise professionals understand consumer preferences.
Also a finalist in this category, SAP sees the continued growth in the mobile market and the emergence of wearable technology as trends that fit very well into their current and future projects, employing user experience design to help human beings make sense of big data, and designing better applications utilizing wearable, mobile technology, and smart metering (a.k.a. the internet of things).
“The prevalence of wearable and mobile devices in the consumer market present huge opportunities for business,” says Head of Strategic Design Services Janaki Kumar. “Businesses have access to a lot more qualitative and quantitative information about their customers, allowing them to learn more about their customers buying habits and preferences. Businesses that learn to harness this knowledge and make informed decisions will have a competitive edge.”
Kumar notes that, at the same time, all of this data needs to be analyzed by human beings within an organization, making it important to present the information in a way that is not overwhelming and will help them make good decisions.
“This is the challenge facing business interfaces today, and will become more so in the future.”
More Cutting-Edge Data Wranglers
There were other notable applications in the contest from teams taking different approaches to making sense of all this data:
A dynamic service for searching social media, Thrive is trying to conquer big data in small steps, focusing on answering one question first, and then the next. SiSense enables business users who aren’t tech-focused to analyze and visualize growing data sets from a vast pool of structured and unstructured data sources by combining a beautiful front-end with a powerful back-end. Partnering with the Terrestrial Ecosystem Research Network and development partner QCIF, Peak Usability created a data discovery portal for scientists to collect, contribute, store, share, and integrate scientific data from multiple facilities and databases across Australia. Infor | Hook & Loop created a mobile sales application based on data visualization starting with the idea of data democratization. Working with the government in British Columbia, FCV Interactive turned a “goldmine of data, some of it open and accessible, but some of it still locked up in an impenetrable statistics website,” into a navigable, interactive jobs site. A lead designer at Shadowbox, Adi Fleisher saw big data as a portal for proving the validity of Astrology. Mad*Pow created a trio of Corvix applications allowing users to explore public health statistics in India and Saudi Arabia. Delvina used their AskingCanadians online research community to help present data in a way that would “cut through the clutter and the noise.” No stranger to loads of data, MailChimp has developed systems for streaming all data to a central location, so separate teams can synthesize their specific projects to company-wide knowledge.