When it comes to meetings with stakeholders, having a way to quickly validate design decisions can be invaluable. Using piles of data or intuition doesn’t always cut it.
Times are changing and as we searched for solutions at ZURB, we realized that there was nothing out there that aggregated the data we needed. Also missing was a simple resource with data on user habits and trends.
We trolled Google for facts, but it was always a pain to aggregate the material we needed before our meetings. We had some friends outside of ZURB who were attempting to aggregate these facts, but we needed a reference tool. So we decided to start collecting data as an experiment called Quips.
What’s a Quip?
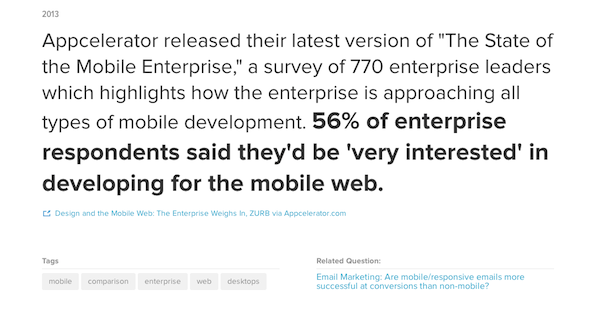
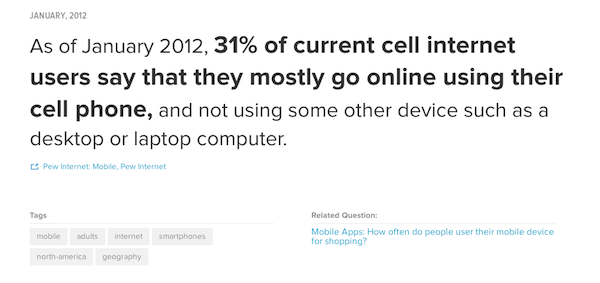
Quips, a reference feature in the ZURB University library, is a growing vault of quotable statistics examining the web from both statistical and human perspectives—how people access the web, what they do online, and how technology evolves. Quips provides data on user habits and patterns so designers and stakeholders have the ability to review their current products and projects with clarity, implement design decisions around today’s trends, and execute new design ideas based on what is known about current user habits.
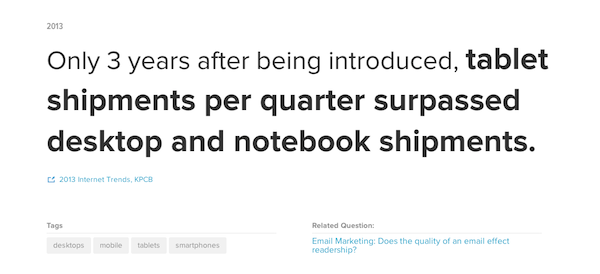
We were coming back to use it every day to uncover design direction and find stats for blogs, classes, and conversations. We accumulated quite a bit of information in a very brief period of time, and once we hit 200 data points, we knew we needed a way to pull reference Quips at a moment’s notice.
This was surprisingly more complicated than we thought—one-off tags meant little, but tags assigned to 50% of quips didn’t help either. Surprises came when we cross-referenced topics, like “mobile” and “adult,” or “ecommerce” and “decline.” Additionally, a few tags were more than topics: “growth” and “decline” describe trends, while “infographic” and “PDF” describe the source’s type.
Built using Rails, we developed Quips with a custom CMS from scratch because we wanted to have a fast data-entry method, and we wanted to keep the project scalable for easy growth. Using a responsive framework Quips users can employ devices like iPads and smartphones for referencing on-the-go and adding facts to the vault, increasing the amount of data that is accessible to designers. We painstakingly check all facts and average 200 new facts a month (5 to 10 a day with a record of 30 in a single day thus far). Today, Quips has over 1,100 facts at-the-ready and continues to grow.
With technology on a direct path towards 100% mobility there are new habit patterns being formed that must be noted and considered for each product that users experience. Quips plays a vital role in our design meetings and work sessions whenever there is uncertainty about a specific piece in the design we are considering implementing.
Quips gives us evidence to support a design direction … based on empirical data
Quips in Action
Recently, Brandon, one of our designers used Quips to validate a design decision on whether or not to use social logins. Quips gave Brandon the ability to quickly pull up this cool fact: “Visitors are 200% more likely to log in to your website using Facebook Connect than any on site login.” Needless to say social plugins were added and the client was stoked.
Quips gives us evidence to support a design direction—allowing us to justify our designs based on empirical data. It’s also a reference and learning tool for product designers to stay up to speed on what’s going on in the market.
The benefit for designers is access to factoids about user habits or trends, which provide a resource for designers to defend their decisions. This presents a resource for designers to research current trends such as the growth of the mobile frontier and what mobile devices are accessed most often in the industry. It can also afford a “big picture” view of where trends may go based on what trends have passed.
Conclusion
Designers are seeing the importance of having facts at the drop of a hat because it helps them make informed decisions. With these statistics, they can look at issues from an analytical perspective and get industry context to designers’ decisions.
We discovered that reliable, accessible sources were vital and will be implementing Quips more often into our design presentation. With Quips we’re giving our designers the ability to grow and use tools that will improve their design process and ultimately improve the design. Stakeholders also have more security in their investment of a designer whose design thinking includes an analytical standpoint.
We’re excited to see what Quips will look like as it grows in the years to come. If you’ve had success organizing and presenting valuable user statistics, please share your stories below.
Image of data cubes courtesy Shutterstock.