Kanban walls, status reports, risk logs … with so many project management tools, it’s easy to fall into the complacent feeling that a project is staying on track. But keeping a project on-track in terms of enhanced user experience goes beyond just hitting that next release deadline: it’s also about adding value to the business and building features that matter to end users. It’s also important not forget the UX debt we may have built up thanks to shoddy software practices.
When it comes to keeping all of these elements in perspective, storymapping is a great technique that can help us focus on the bigger picture, while also keeping our wider stakeholder group (like developers and product owners) aware of the project’s progress. As designers, we are uniquely poised to maximize the potential of storymaps to help visualize the status of our team’s work and bring in a new flavor of project management to the development kitchen.
Let’s examine what storymaps are and then look at how to build one.
What are Storymaps?
Storymaps are an agile tool originally conceived by Jeff Patton in 2005 and further explained in his 2008 article, “The new user story backlog is a map.”
Patton has gone on to write about how storymapping and UX relate, championing storymapping as way to alleviate the lack of common understanding that comes with trying to tie agile and UX together. As he explains, “[S]oftware has a backbone and a skeleton—and your map shows it.”
Agile Alliance defines storymapping rather formally as “a more structured approach to release planning … consisting of ordering user stories along two independent dimensions.” At its most basic though, storymaps are large card arrangements, not too dissimilar to other walls used in software development. The only difference with storymaps is that instead of focusing on the day-to-day “flow” of a team’s development pace, a storymap reveals how tasks relate to larger buckets of work, grouped by activity.
In short, a storymap provides a visual representation of the overall piece of work you’re trying to accomplish at a glance, rather than trying to keep it held up in documents. The photo below shows a story map in practice.
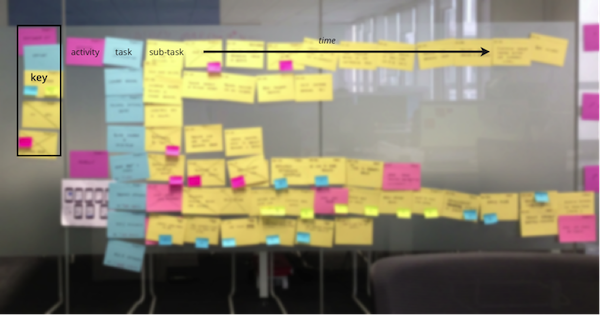
Storymaps are a great addition to any team’s project wall, whether next to in-use Kanban lanes or to-be design mockups. They help to flesh out what an entire project looks and feels like, illustrating how far your team has moved forward without trying to assign everything an ambiguous column.
And the best part about storymaps? You don’t have to use them strictly in agile environments. They work with all sort of activities and tasks. In fact, I’ve used storymaps to track everything from content strategy work to the requirements refresh of a banking system. They’re adaptable to a project’s needs and a team’s desires.
How Do Storymaps Help Projects?
Storymaps help with the planning, prioritizing, and visualizing of project work. Agile coach Steve Rogalsky explains that storymaps not only encourage iterative development (which is a key to evolving the design of a user experience), but also help with outward progress tracking—an added benefit for most visually oriented designers.
It’s often hard to track how big a project is and where we’re adding value. Storymapping takes a different approach to project management, looking at the entire project as a whole, using groupings to break the work up in manageable chunks.
Storymapping takes a different approach to project management, looking at the project as a whole
Storymapping is not too far off from release mapping, but instead of thinking about our work in terms of batch releases, we think about it in terms of activities. As we begin each unit of work then, we can strike a line through it, X-ing entire tasks out once only they’re complete. This allows team members and stakeholders alike to see how far the project has moved. Most importantly, it helps people outside the project ask key questions about what’s holding the team back, providing insight and transparency into our work without formalizing the process.
How Do You Build One?
The creation of a storymap depends largely on what type of work you’d like to map out.
Start by breaking down your larger project into tasks (e.g. user stories or simple “to do” items) and translate them onto cards. Each task should be easy enough to accomplish within a reasonable amount of time (I try to keep tasks to a maximum of two weeks).
As Andrea Gigante reminds us, storymaps are very much alive, so we shouldn’t try and plan tasks that might take us into the ensuing years. Keeping them capped at about two weeks helps keep us honest with ourselves, and our stakeholders.
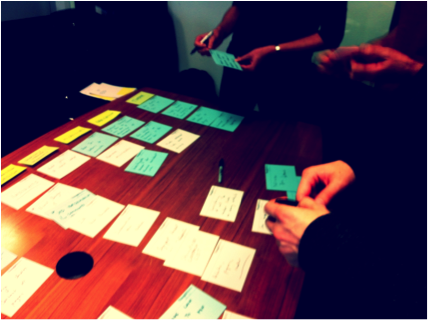
Next, sort your tasks into categories. There are two ways to do this: an open card sort or a closed card sort. Card sorts here would be essentially grouping your units of tasks into logical “activities” based on similar properties.
An open card sort allows you to figure out how things fall together randomly, while a closed card will help you align activities to business terminology. I prefer to use open card sorts as it allows me to define the grammar that shapes the project I’m working on. Designer Mike Long noted in his blog post on activity maps that mapping is great in this way, helping teams “create a precise and elegant lexicon that will sharpen [our] understanding about what [we] are trying accomplish.”
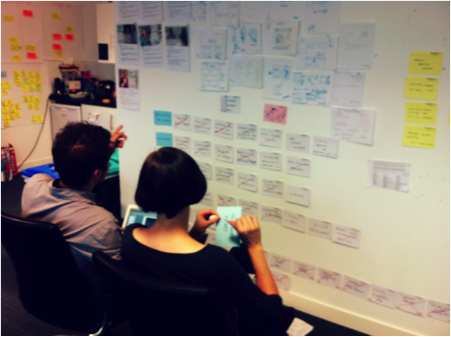
Lastly, organize your cards onto a wall in a clean and visible format. Jeff Patton and Steve Rogalsky put tasks under activities vertically, while others prefer to use a horizontal format.
I’m fond of the horizontal variety because you never know how big a story map will get. I tend to keep up all old tasks for an entire project, as it shows just how big a piece of work is actually becoming.
There’s also an opportunity to add personal touches: I’ve had colleagues who insist on using sickies as a visual key to track cross-functional requirements, while others swear by using different color cards so that we don’t get confused by which tasks are assigned to which activity.
Again, the styles for building a storymap are endless. Improvise and adapt the technique to your own benefit.
A Word to the Wise
While storymaps are a fantastic technique to focus on outcomes over outputs, they’re only successful if a wider stakeholder group has adopted them. I’ve had experiences trying to implement storymaps where I made the mistake of not including key team members in the creation process. Without this buy-in and participation from across different parts of the organization, the storymap was a useless artifact.
Check out Steve Rogalsky’s “Tips for Facilitating a User Story Mapping Session” to learn more about introducing storymaps to your teams in effective manners.
Bottom Line
Storymaps are only one tool to track the bigger picture as a team. When all is said and done, you should find a technique and style that suits your team best. As Laura Busche shared in her recent Smashing Mag article, any sort of working wall is “an invaluable tool for design thinking.”
Image of sticky notes courtesy Shutterstock.