- Content and Copy, Contests and Giveaways, Customer Experience, Data visualization, Design, Facebook, Flow and Immersion, Gestures, Google, Interaction Design, Location-Based Services, Mobile Applications, Mobile Technology, New and Emerging Technologies, Product design, Prototypes, Sketching, Storytelling, Technology, Touch, Twitter, Ubiquitous Computing, Usability, Visual Design
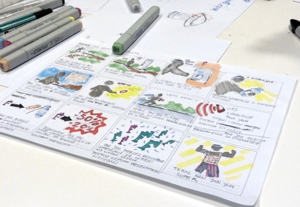
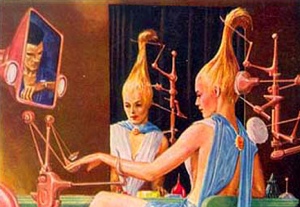
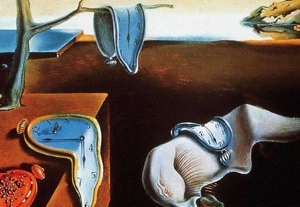
The winners of our Drawing Ideas giveaway use sketches to imagine hypothetical uses for wearables.
Article by UX Magazine Staff
Share:The Future of Wearable Technology in Pictures
Share this link
- October 16, 2014
3 min read