- Business Value and ROI, Consumer products, Content and Copy, Content Strategy, Customer Experience, Data visualization, Design, Design Theory, Design Tools and Software, E-commerce, Emotion, Empathy, Flow and Immersion, Human factors, Information Design and Architecture, Interaction Design, Interface and Navigation Design, Marketing and Brand, Mobile Applications, Mobile Technology, New and Emerging Technologies, Personal and Professional Development, Product design, Project Management, Psychology and Human Behavior, Research Methods and Techniques, Sketching, Software, Storytelling, Strategy, Team Dynamics, Technology, Usability, User Acceptance Testing, Vendor-Client Relationships, Visual Design, Working With Stakeholders
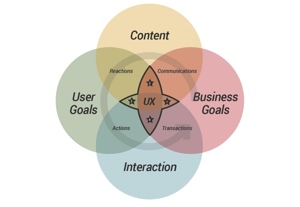
Frustrated with confusing, unorganized, complex, or antiquated antiquated user experience models, a designer at The Nerdery created the CUBI model.
Article by Corey Stern
Share:CUBI: A User Experience Model for Project Success
Share this link
- September 25, 2014
10 min read