Part of my work in helping companies improve their products and services includes, naturally, analytics.
And so a few months ago, while creating a metrics dashboard for a client I had an epiphany: “if a product is only viable when User, Product and Business are equally present (thinking of the product triad), how come most of the existing frameworks focus on isolated parts of the trilogy?
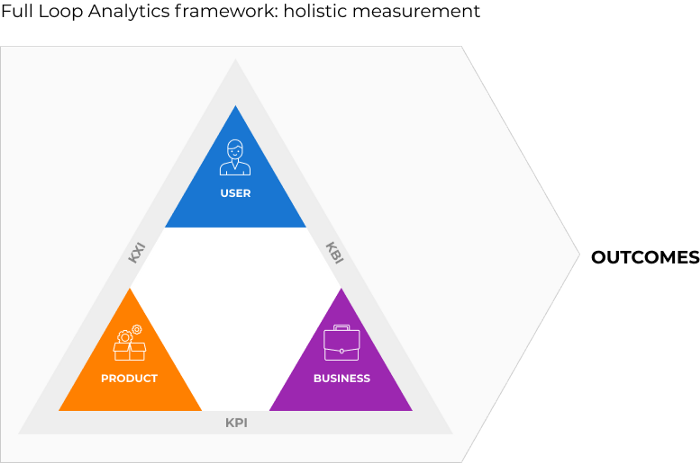
That was the light bulb moment that gave birth to the Full Loop analytics framework. I realized I needed a metrics framework that provides a holistic view of the performance of a product by looking at its 3 key dimensions: user, product and business. The “holistic view” being a key concept.
This way of looking at metrics takes organizations out of a fragmented vision and moves them into a holistic one. In other words, this framework takes organizations from output to outcome focused product metrics.
This is the framework that I presented at Interaction Latin America (ILA), in November 2019 in Medellín.
Where does this framework come from?
To understand this framework we first need to look at the product triad.
The product Triad
For a product to be viable, its three key components – User, Business and Product- need to be equally represented. This is the famous product triad or trilogy.
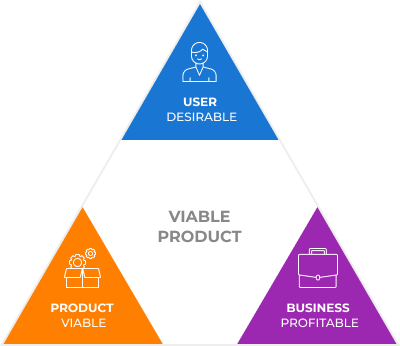
The User dimension represents the desirability of a product, the Product (or Technology) dimension is the technical feasibility and the Business dimension is the profitability aspect.
When one of these 3 areas is not equally represented, the viability of a product is at risk:
- If you have a product that you can make, which is also profitable, but users are not interested, you don’t have a product.
- If you have a product that is desirable and feasible but is not profitable, you don’t have a product either.
- And if you have a product that is desirable and profitable, but can’t produce, you also don’t have a product.
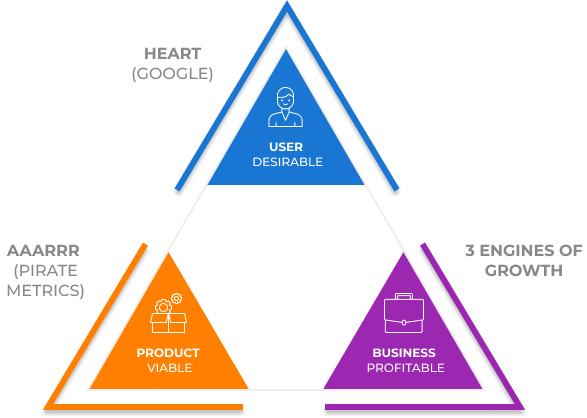
Existing frameworks
So, looking at the most commonly used frameworks I realized that most of them focused on isolated parts of the triad, but none looked at the system as a whole:
The Full Loop Analytics Framework
The underlying concept
Once I realized this, I started developing a framework that not only considered all 3 dimensions, but most importantly, focused on the relationship between the areas.
The relationship between the areas is key, because if we don’t look at this then this framework is just like the rest, but with 3 times more metrics! That’s why the focus on the relationship between the areas is the key differential point of this framework.
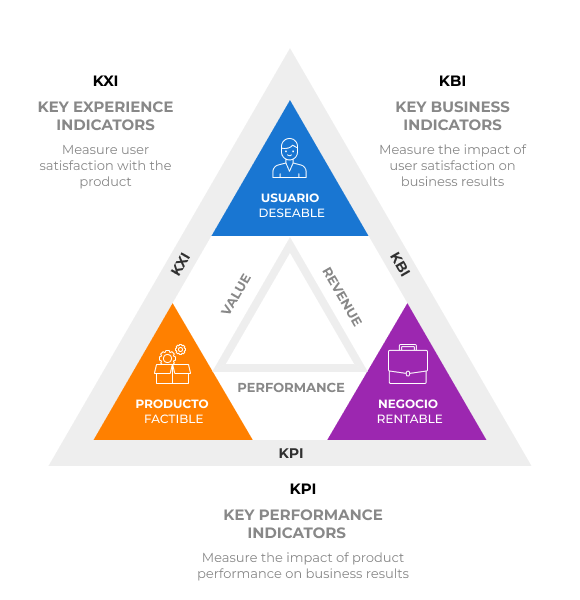
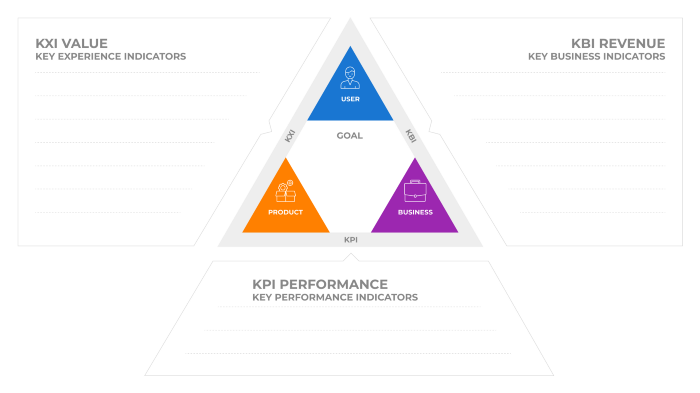
So, with this idea, the 3 groups of indicators emerged:
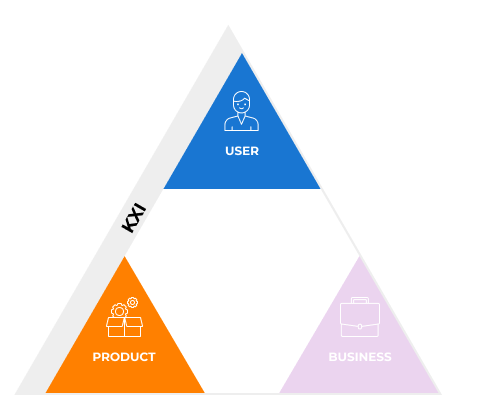
- Key Experience Indicators (KXI), look at the performance of the product as a result of user satisfaction.
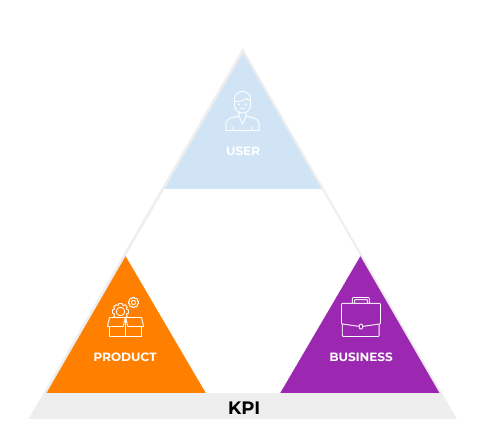
- Key Performance Indicators (KPI), measure the impact of the product performance on business indicators.
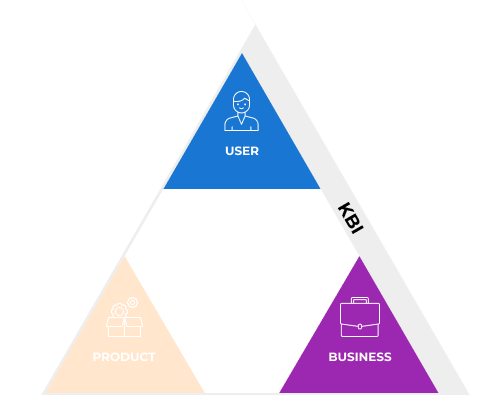
- Key Business Indicators (KBI), measure the impact of user satisfaction on business performance.
Framework metrics
KXI: Key Experience Indicators
Definition: Key Experience Indicators measure the relationship between User and Product, understanding product performance as a result of user satisfaction.
By using KXI, designers can measure how user experience impacts directly on product performance.
Usage: when we stop looking at Product and User metrics in isolation and focus on the relationship between them, we can see how product metrics match directly to user metrics. For example:
- Sales become the expression of the satisfaction or utility that users get from the product
- Conversion (funnel performance) can be viewed as the result of the usability of the system
- CTR (Click through rate — for emails or campaigns) as the expression of the perceived value.
Sample metrics: when we use KXIs we typically look at both user and product metrics, such as:
- Usability: effectiveness, efficiency, satisfaction
- Qualitative user metrics: experience, value, utility, perception, clarity
- Product metrics: sales, conversion, recurrence, frequency of use, frequency of purchase, funnel performance.
Key performance indicators (KPI)
Definition: KPIs measure the impact of product performance on business results. In other words, KPIs look at product metrics in terms of business results.
Usage: when we look at product metrics in terms of business impact we can match product metrics to business results. For example:
- the performance of a campaign –measured in terms of CTR (click through rate), impressions, reach- have a direct impact on the ROI of the campaign
- the performance of our SEO efforts has impact on the Cost of Acquisition
- Churn and frequency can be directly related to Customer Lifetime Value (CLTV)
Since this framework’s KPIs show the impact of product performance on business results, Product Managers and Product Owners can show how much value they are contributing to the organization.
Sample metrics: when we use KPIs we typically look at both product, business and financial metrics, for example:
- Product metrics: sales, recurrence, churn, frequency, average items per cart, average cart value.
- Business and financial metrics: customer lifetime value (CLTV), customer acquisition cost (CAC), cost per lead, cost per sales, ROI, profitability
KBI: Key Business Indicators
Definition: Key Business Indicators measure how user experience impacts business results.
These are one of the most interesting indicators of the model because here’s where we can measure the cost of business decisions such as marketing, pricing, communications or customer service policies to name a few.
In other words, KBIs measure the impact of UX, CX and BX decisions on business results.
Usage: KBIs are used to match user behavior to business results. For instance:
- When marketing decides to communicate a discount in an intricate way to make it look better than it is…
- When the small print hides key restrictions to the service…
- When customer care decides to give limited support to less profitable customers…
… the impact of these decisions on business results can be immediately measured both in terms of “soft” metrics like brand sentiment, brand value or NPS, and “hard” metrics like sales, cost of customer care (more people calling the call center and longer call time), cost of acquisition, cost of sales, retention, loyalty.
When we can quantify how business decisions that affect the customer experience impact business results, the value of UX is evident.
And conversely, when UX areas can quantify their impact on the business, it is much easier to demonstrate its value and their impact on business results.
Sample metrics: KBIs look at user and business metrics, such as:
- Qualitative: brand perception, voice of customer, brand sentiment, brand value, NPS, brand equity, loyalty.
- Financial: profitability, customer lifetime value (CLTV), cost of customer care, cost of acquisition (CAC), retention.
How organizations measure today and why it is a problem
The problem is not that organizations don’t measure performance. In fact, many organizations have the opposite problem and suffer from “death by data”.
It isn’t a problem of not sharing data either: many companies have large dashboards of cross organizational data, a some share them real time on big screens.
The problem is that metrics get compiled, analysed and optimized in silos. And as a result, organizations measure output (metrics for each area) rather than outcomes (results for the company as a whole).
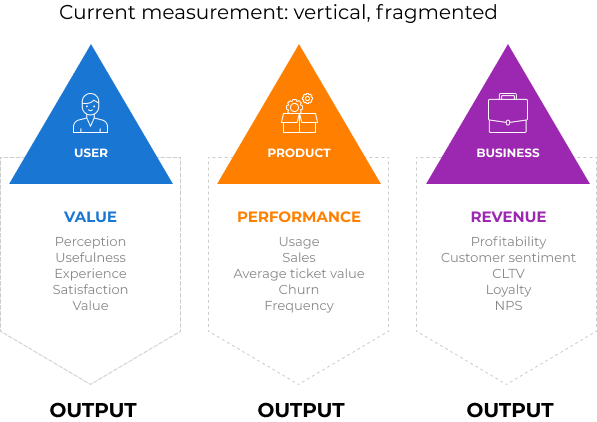
When you have a fragmented, vertical way of measuring performance, improvements in the metrics of one area may end up having negative impact in the metrics of another area.
Let’s say that it’s Black Friday and the goal of the Product team is to improve sales. So they set up an online marketing campaign to attract customers. But if once on the site the purchase process is confusing and clients can’t place orders, then the campaign might have had a good performance in terms of CTR, visits to the site and virality, but a negative impact on user experience (frustrated users that may never come back), increased customer care calls (increasing the cost of sales) and affected negatively other business indicators such as ROI and profits.
By looking at the relationship between all areas of a product, the Full Loop Analytics Framework takes organizations out of a vertical, segmented view, proposing a holistic analysis.
How to use the framework
Step 1 — Goals
Nothing new here. Before measuring anything, we need to know what we’re going to measure and why: what business issue are we trying to solve? What questions are we trying to answer? There are two big categories of measurement:
- Operational initiatives, which are specific actions such as promotions, campaigns, etc. that occur in the short term.
- Strategic initiatives whose results take longer to implement and show results, such as “increase the use of digital channels”, or “improve customer satisfaction with X”
Step 2 — Define the metrics
Once we know what we are going to measure we can define the metrics we are going to use — ideally no more than 3–5 metrics per area. And we use the Full Loop Analytics canvas to list those metrics.
Let’s say for instance that we want to define the metrics for the Summer sales campaign whose goal is to reduce stock.
- The first thing we want measure is how much we increased sales and how much we decreased the stock of the desired items (1).
- For that to happen, conversion must be positive, both in terms of campaign and sales (2).
- And from a business perspective, campaign has to have a positive performance both in terms campaign metrics as well as ROI (3).
The completed canvas would look something like this:
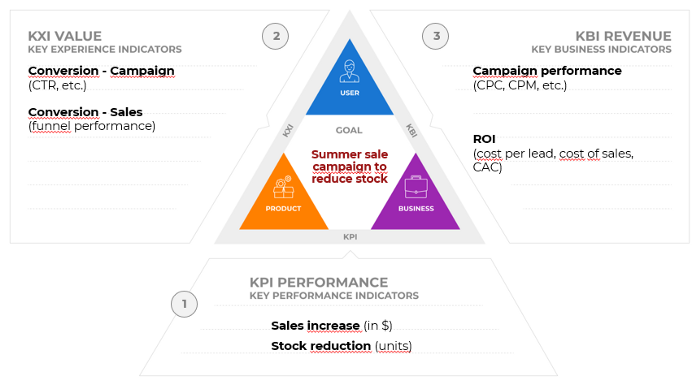
As you can see, we don’t just make a list of metrics for each area. Rather, we start by defining the most important metric (in this case sales and stock) and from there we define the key metrics for the rest of the areas that have to move in the same direction so that our business goal can be attained for the organization as a whole.
This way of measuring performance:
- provides a holistic view of product performance,
- makes sure that improvements in one area don’t have a negative impact on others,
- and ensures that everybody is thinking in outcomes (company-wide results) rather than outputs (individual metrics)
How to apply the Framework in your organization
Since the framework takes metrics from different areas, ideally one representative from each area should be present when building the dashboard. That’s why the ideal way to use the framework is in a workshop, which usually runs for a half day.
During the workshop is important to use a methodology that facilitates interaction and understanding between areas, in order to tackle a few common issues:
- A metric may mean different things to different areas. Conversion and customer are great examples of that.
- There are different expectations regarding the behavior of a metric.
- O there are metrics that may be measured differently across areas, for instance ROI, cost of acquisition, cost of sales.
- Or that the goals of one area create negative impact in other areas
If you want to learn more about how to run the workshop you can DM me through LinkedIn for more information.
In short…
The Full Loop Analytics framework:
- Helps organizations think in outcomes, not outputs. Results, not silos.
- Aligns all areas, enables conversations, promotes a common language and improves collaboration.
- Enables organizations to visualize the impact of different initiatives across the whole organization.
- And lastly, measuring usability along business metrics takes design out of the pixel management and into conversations of a higher level.
Useful links
Framework template