Last year was an awesome one for the data visualization industry. With more and more businesses realizing the value of data visualization for deriving critical business insights, the year ahead looks very promising, too. IIA (International Institute for Analytics), an independent research firm focusing on the use of analytics, recently issued its nine analytics predictions for 2014.
Among other things, it predicted that the use of data visualization will increase both for low and high complexity analytics. However, Thomas H. Davenport, Co-Founder and Research Director at IIA, had a caveat for those trying to use visualization in instances involving highly complex, multivariate statistics: “That gets tricky because humans don’t comprehend things in more than two dimensions or, at most, three dimensions.”
In a scenario when more and more businesses are waking up to the idea of data-driven decisions and looking for applications powered with visualization capabilities to help them comprehend their data well, the information dashboard is set to take some big steps. Here are five changes on the horizon that will deepen user experience with data.
1. More Independent Software Vendors will Include Powerful Information Dashboards as Part of their Key Offering
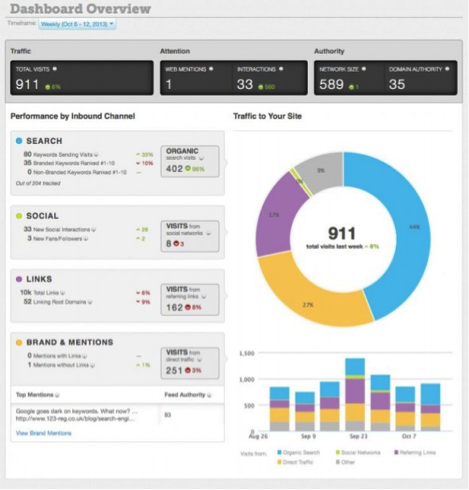
In 2013, we saw many ISVs adding data visualization capabilities to their products. In May 2013, the quintessential SEO software SEOmoz not only changed its name to Moz but also expanded its offering to include an exclusive analytics platform, Moz Analytics. The new platform allowed users to manage all their digital analytics in one place. The analytics dashboard provided insights into a company’s search, social, and referral traffic. Users could track traffic generated to their website, how many people have been mentioning their company online, the influence of their content, and which of their digital properties is creating the most buzz.
And the information dashboard was not limited to marketing alone. On December 4th of last year, Vigillo LLC, creators of data mining software products designed to aggregate, organize, and deliver complex fleet safety information in an easy-to-read scorecard format, announced its new Athena Big Data Business Intelligence platform.
Named after the Greek goddess of wisdom, Athena is an open source Big Data solution that gathers data from a wide variety of sources, distills it into understandable information, and then presents it in a straightforward format that trucking companies can use to improve a range of operational factors. The web-based solution is accessible through all types of devices and provides data-visualization through interactive dashboards and a report deployment scheduler.
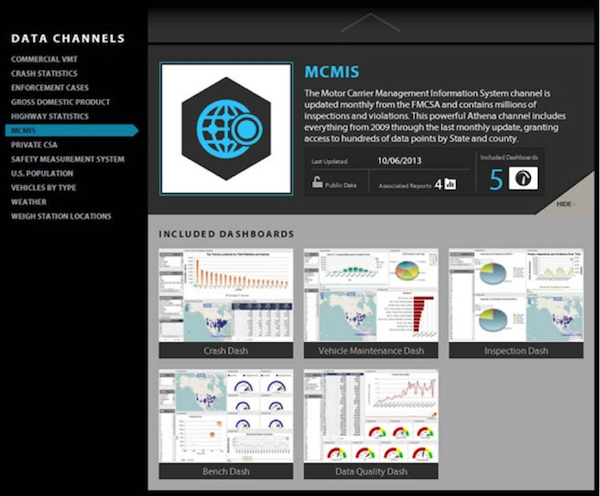
Initial Athena reports will be presented in a set of about 30 highly customizable dashboards for effectively managing safety, operations, sales, maintenance, fuel purchasing, and driver recruiting and retention, among others.
In 2014, more and more ISVs will add these capabilities to their products and users will be adopting the information dashboard in a bigger way.
2. Information Dashboards Catering to the Specific Needs of the On-the-Go User
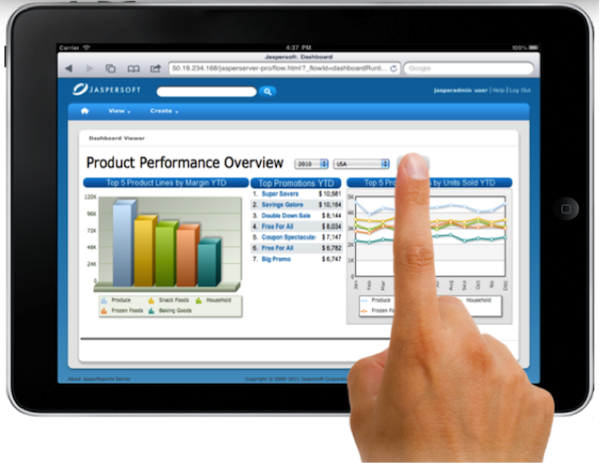
Ease of use is critical to the success or failure of an information dashboard. As we become more and more addicted to our smartphones and tablets, the dashboard will evolve further to incorporate the needs of the on-the-go user.
Cramming a desktop application into the limited real estate of the mobile device will no longer suffice. ISVs really have to think through the information needs of the mobile user, keeping in mind the human-computer interaction rules on a small screen device.
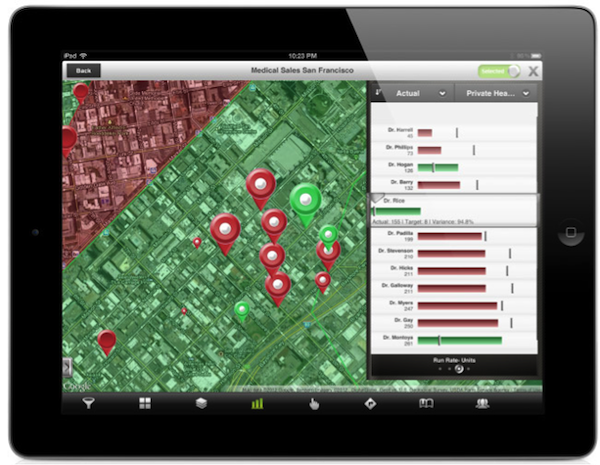
From a static view of data to interactive reports, the mobile dashboard will evolve to become more powerful in 2014. We can see doctors drilling down into a patient’s history while on a round instead of sifting through piles of files and marketers pinching or swiping screens for specifics about a particular data set.
3. Information Dashboards with High Location Intelligence Quotient
Consider this as yet another off shoot of developments in mobile technology. Traditionally, web dashboards use maps to visualize performance metrics based on different geographies.
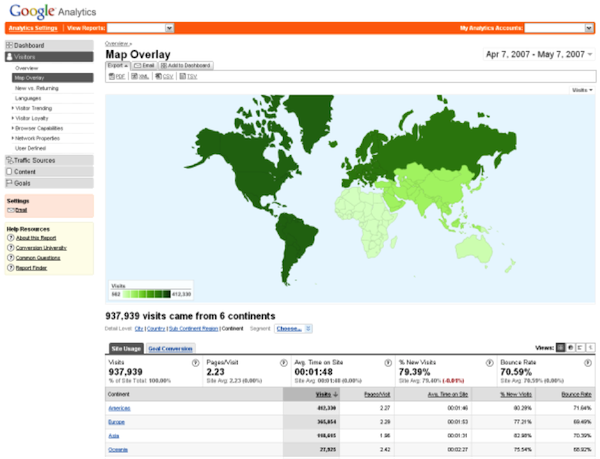
Google Analytics uses a map to show the countries from where your visitors are coming from.
With mobile devices embedded with GPS technology, the location intelligence quotient of your dashboards is going to improve vastly. While traditional maps can provide you with data regarding the location of a specific asset, these GPS-powered mobile dashboards will help you prioritize information by geographic proximity. So expect location-intelligent mobile dashboards that will alert store managers of the shortage of a SKU as they pass through the aisles of their store or inform a courier with the best route to ensure on-time deliveries.
4. Dashboards Catering to the Here and Now
Real-time data became a buzz word in 2013. It will only buzz louder in 2014. No longer will the user be restricted to historical data for analysis, they will be able to capitalize on instant data to find new opportunities. From marketers monitoring the performance of their online campaigns and fine tuning them for better results to retail shop owners targeting their in-shop customers with real-time offers, more and more businesses will look to real-time data to provide actionable insights.
In a recent series of articles on Real-Time Data Visualization for our FusionCharts blog, we saw how businesses are approaching real-time business intelligence in a way that empowers their decisions. Using real-time dashboards they track key business metrics like payment failures. Failures are logged as soon as they happen and are updated in the dashboard within milliseconds. Analysts then use the information to quickly identify and respond to the top issues first when the failure rate spikes. And for an e-commerce portal, prioritizing and solving payment issues at the right time is vital for survival.
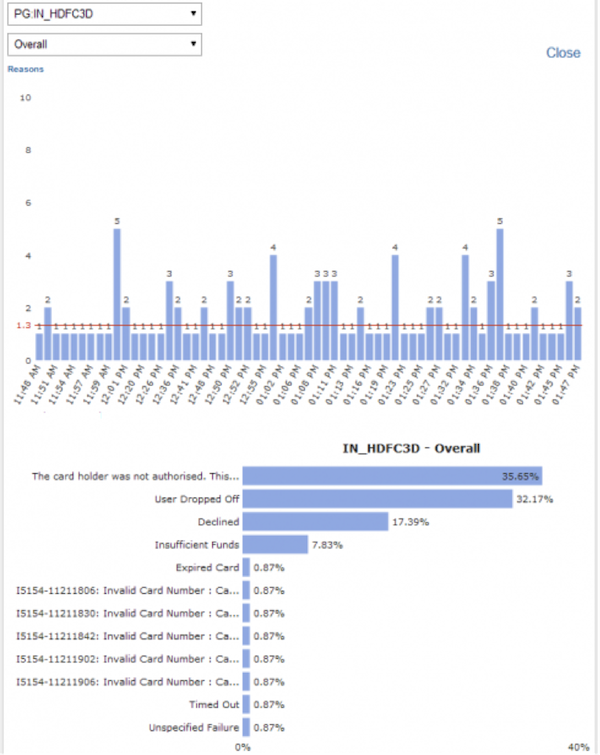
Cleartrip, one of the leading online travel companies in India and the Middle East, uses real-time data dashboards to track payment failures and respond to issues at the right time.
5. Information Dashboards That Can See The Future
While we’re used to weather forecasts, election forecasts and predictive text features on our smartphones, predictive analytics will be the next big thing in information dashboards. Extracting information from data and then using it to predict trends and behavior patterns will help business to plan their resources better. Retailers can avoid out-of-stock situations and expensive write-offs, manufacturers can predict the usage of their facilities and plan for more capacity and financers can easily identify fraudulent loan applications and assess liquidity and credit risks.
Predictive analytics will be the next big thing in information dashboards
IBM lists seven ways by which users can benefit from predictive analytics:
- Compete: Secure the Most Powerful and Unique Competitive Stronghold
- Grow: Increase Sales and Retain Customers Competitively
- Enforce: Maintain Business Integrity by Managing Fraud
- Improve: Advance Your Core Business Capacity Competitively
- Satisfy: Meet Today’s Escalating Consumer Expectations
- Learn: Employ Today’s Most Advanced Analytics
- Act: Render Business Intelligence and Analytics Truly Actionable
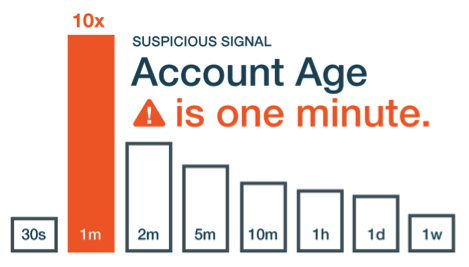
Sift Science is one such application that uses machine learning to help e-commerce sites predict fraud.
Among other things, predictive analytics along with real-time data will gradually be employed in information dashboards for sales forecasts, fraud prevention, preventive medical intervention, and so on.
Final Thoughts
Information-on-the-move will be a key feature of the information dashboard in 2014. While web dashboards will provide users with in-depth insights and analysis, the mobile dashboard will be tailor-made to suit the information requirements of the user-on-the-go. Location intelligence, real-time data and predictive analytics will further make the dashboard richer and enable users to gain crucial business insights from their data.
Where do you see the information dashboard in 2014? Add your thoughts in the comment section below.
Image of information dashboard on mobile courtesy Shutterstock.