Great products aren’t magically conceived. They’re molded over time by observing and understanding people in order to identify core needs and thoughtfully solve for them. Building great products requires continuous feedback and iteration. Collecting and analyzing relevant quantitative and qualitative data will help you make more informed and strategic decisions. Using quantitative and qualitative data in tandem will help you understand what’s going on and why, and investigating a variety of product metrics will help you evaluate your product’s holistic health and identify key opportunities for impact.
Quantitative vs. Qualitative Data

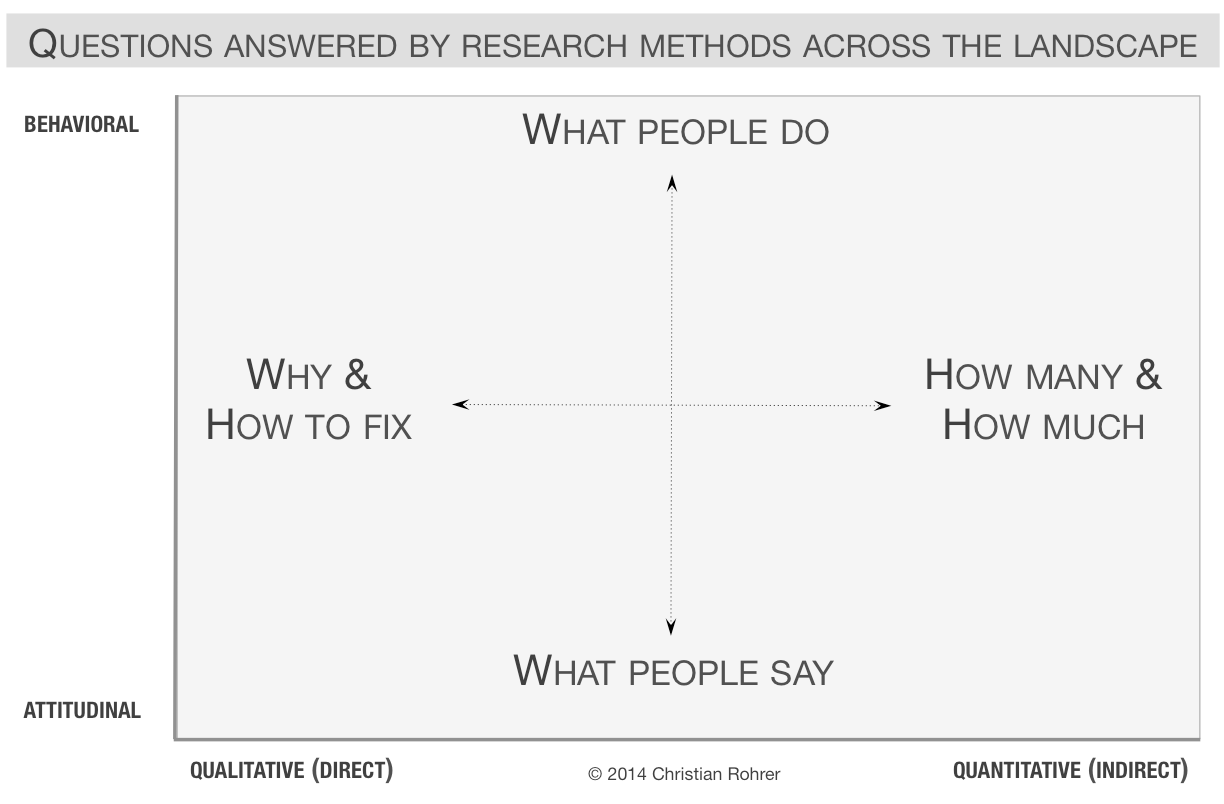
Quantitative data helps you understand what’s going on at scale. It answers how many and how much. Product usage data will tell you how many clients are using a newly launched feature, A/B testing data will tell you how much better one design performed compared to another, and survey data will tell you how many clients prefer each roadmap item.
Types of quantitative data include:
- Product analytics
- Survey data
- Usability metrics (i.e. success rate, time to completion)
- Customer effort score
- Customer satisfaction
- Net Promoter Score/Net Value Score
- A/B testing or multivariate testing
- Card sorting
- Tree testing
- Eyetracking testing
- Clickstream analysis
Qualitative data helps you understand why things are happening. It answers why and how to fix things. One-on-one interviews may illuminate that clients don’t notice the newly launched feature because it’s hidden in dense navigation, session replays may show that the preferred design aligned with users’ mental models more seamlessly, and open-ended response fields in the survey allow clients to explain why they prefer certain features over others.
Types of qualitative data include:
- Ethnographic field research
- Interviews
- Focus groups
- Diary studies
- Participatory design
- Concept testing
- Usability testing
When and How to Pair Quantitative and Qualitative Data
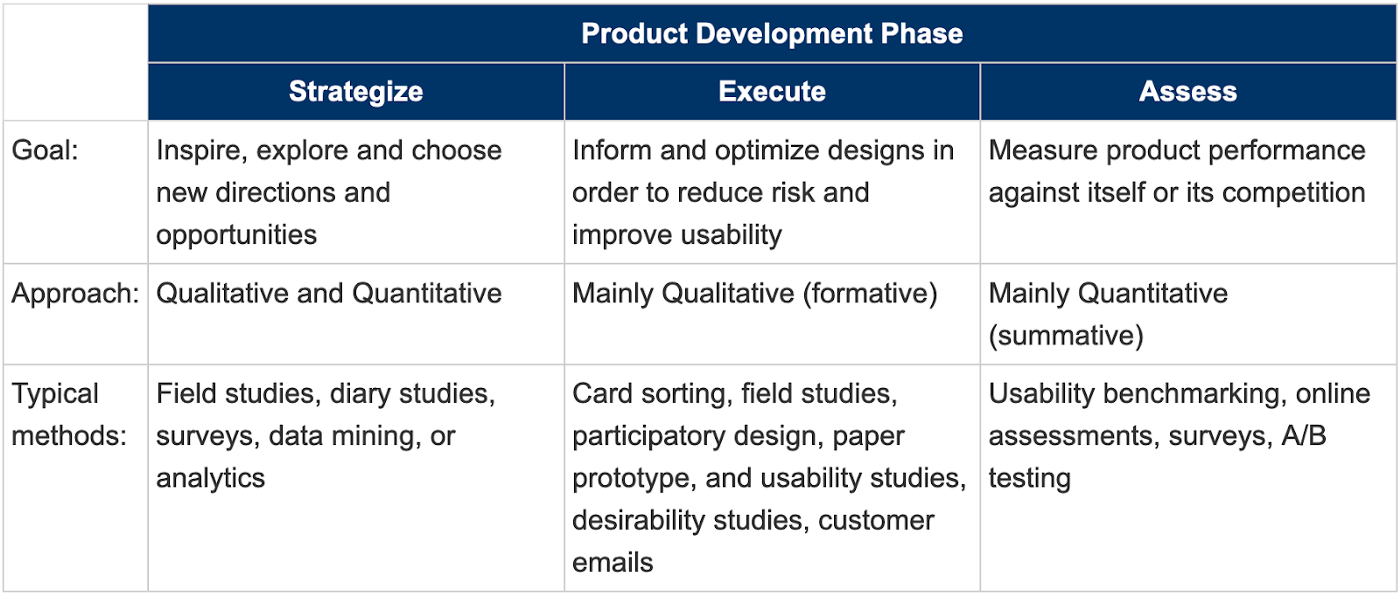
Now that we understand the value of quantitative and qualitative data, we can think about pairing them in order to get a better sense of a product’s overall health and key areas of opportunity. There are three main phases in product development: 1) strategizing, 2) executing, and 3) assessing and qualitative and quantitative data come into play in each stage.
Phase 1: Strategizing
During the strategizing phase, you focus on deeply understanding your users and their core needs. Once that’s clear, you can begin to brainstorm and explore a variety of possible solutions. Quantitative data, such as product analytics, surveys, and data mining, can help you identify common bottlenecks, drop off points, or unused features within your product. This data helps identify large-scale and impactful issues to focus on. Qualitative data, such as ethnographic field research and one-on-one interviews, can help you uncover pain points and identify completely new user needs and workarounds to address and build on. This data helps identify severe and unexpected issues to focus on.
You can start with quantitative data to uncover large-scale problems and then use qualitative data to uncover why they’re occurring and how to fix them, or you can start with qualitative data to understand key pain points and unmet needs, and then use quantitative data to confirm that these pains and needs exist within a large percentage of your userbase.
Phase 2: Executing
During the execution phase, you build on your previous work and dig deeper into the possible solutions. What is and isn’t working? How can you improve them? Which solution is most viable? After several iterations, you should be honing in on one main solution. Qualitative data, such as participatory design, interviews, and concept testing, is key during this phase in order to understand if your proposed solutions are meeting users’ needs efficiently and effectively.
Phase 3: Assessing
Finally, in the assessment phase, you evaluate your solution more rigorously. How is it performing? Are there any outstanding issues that need to be addressed? Can it be further optimized? Quantitative data, such as A/B testing, surveys, and usability metrics, is paramount in this phase in order to evaluate your solution more objectively and make final tweaks as needed.

Putting it All Together: Two Case Studies
Case Study #1: Let’s say you’re conducting research on how to define and build out a brand new product. Your research process might look like the following:
Step 1: Conduct ethnographic field research to observe clients in their offices and uncover core needs and requirements (qualitative)
Step 2: Launch a survey to validate that the needs identified in step 1 exist at scale and rank/prioritize requirements to help determine what to include in the MVP (quantitative)
Step 3: Conduct a few rounds of concept testing to collect feedback on various prototypes and iterate on them as needed (qualitative)
Step 4: Launch an A/B test of the top two designs (quantitative)
Step 5: Conduct a round of usability testing and collect ease of use metrics (qualitative + quantitative)
Case Study #2: Or perhaps you’re conducting research to identify ways to improve a very mature and profitable product. Your research process might look like the following:
Step 1: Conduct a round of usability testing to understand pain points, bottlenecks, and unmet needs (qualitative)
Step 2: Analyze product metrics to validate that participants’ issues identified in step 1 exist at scale (qualitative)
**Note: you can flip the order of step 1 and 2. You could also use product analytics to uncover dropoff points and usability issues and then talk with users about why they’re happening**
Step 3: Conduct exploratory interviews to help define a new feature that will address unmet needs (qualitative)
Step 4: Conduct a few rounds of concept testing to refine and iterate on designs (qualitative)
Step 5: *Optional* launch an A/B test of the top two designs (quantitative)
Step 6: Conduct a round of usability testing and collect ease of use metrics (qualitative + quantitative)
Conclusion
Collecting timely quantitative and qualitative data will help you identify specific ways to improve your product. You’ll have more information on how clients are using your products, what’s working, and where clients are struggling. Once you pinpoint severe and/or large-scale issues, you can make more informed and strategic decisions around where to focus your resources. Using quantitative and qualitative data in tandem will give you the most holistic view of your product and identify high-impact opportunities.
References
B2B International. (2020). The Net Value Score (NVS). Retrieved from https://.b2binternational.com/research/methods/pricing-research/net-value-score-nvs/
Bernazzani, S. (2019). The ultimate guide to your Net Promoter Score (NPS). HubSpot. Retrieved from https://blog.hubspot.com/service/what-is-nps
Birkett, A. (2018). What is Customer Satisfaction Score (CSAT)?. HubSpot. Retrieved from https://blog.hubspot.com/service/customer-satisfaction-score
Birkett, A. (2019). What is Customer Effort Score (CES)?. HubSpot. Retrieved from https://blog.hubspot.com/service/customer-effort-score
Moran, K. (2018). Quantitative user-research methodologies: An overview. Nielson Norman Group. Retrieved from https://.nngroup.com/articles/quantitative-user-research-methods/
Ratcliff, C. (2018). User Research: a comprehensive guide to quantitative and qualitative UX research methods. Retrieved from https://.userzoom.com/blog/quantitative-and-qualitative-user-research-methods-complete-guide/
Rohrer, C. (2014). When to use which user-experience research methods. Nielson Norman Group. Retrieved from https://.nngroup.com/articles/which-ux-research-methods/


