Flag

We stand with Ukraine and our team members from Ukraine. Here are ways you can help

Home ›› Data visualization ›› Page 11

Data visualization

Read these first

A learning initiative between Harvard and MIT, edX is creating an open-source learning platform with Google that’s poised to change the experience of higher learning.

Article by Livia Veneziano
Share:In Search of Knowledge: MOOC.org Will Change the Experience of Learning
5 min read
in-search-of-knowledge-small

Designing apps for users in a healthcare setting, requires an understanding of the emotional states of patients and doctors.

Article by Lorraine Chapman
Share:Accounting for Emotion in Heathcare Experience Design
7 min read
emotion-in-healthcare-small

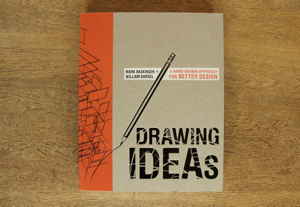
Join us on a video tour of Drawing Ideas: A hand-drawn approach for better design, the new book by Mark Baskinger and William Bardel.

Article by UX Magazine Staff
Share:Flipping Through Drawing Ideas
1 min read
drawing-ideas-small

The results page is a crucial piece of the search experience, and presents an opportunity to meet users’ information needs and engage a dialogue that guides them.

Article by Tony Russell-Rose
Share:Designing Search: Results Pages
12 min read
results-page-small

A pair of brain activity visualization projects illustrates concepts and themes that affect human behavior and the realm of experience design.

Article by Hunter Whitney
Share:Exploring the Brain Through Experience Design
9 min read
exploring-the-brain-small

A closer look at the Design for Experience awards category: Bringing Order to Big Data

Article by UX Magazine Staff, Design for Experience
Share:Design for Experience: Bringing Order to Big Data
2 min read
dfe-order-to-big-data-small

Tell us about you. Enroll in the course.

    This website uses cookies to ensure you get the best experience on our website. Check our privacy policy and