The more digital your customers become, the more individual their buying experience becomes. Like bees to the hive, their journey can be random, taking any path at any time, doubling back or going elsewhere.
The one thing you can count on is that they all want a flawless trip no matter what path they choose. The world’s top UXers understand this, designing experiences that leave customers happy and buzzing.
The more digital your customers become, the more individual their buying experience becomes
The secret to designing for the needs of an unpredictable customer journey is in digital performance analytics. More specifically, measure the “delivered” experience as well as the “perceived” experience to provide the most accurate picture of customer satisfaction.
By combining perceived experience data like what you’d get from traditional A/B testing and surveys with the delivered experience data, sourced from supporting tech infrastructure data (most often found in IT), you’ll be able to identify trends in user behavior in real-time AND connect back to IT groups when you need their support.
Fueled by this combined analytical approach, we can make informed UX decisions that address the needs of all our bees *cough* I mean, customers. With some of the stats from the infographic below, you can start crafting experiences based on these observations today!
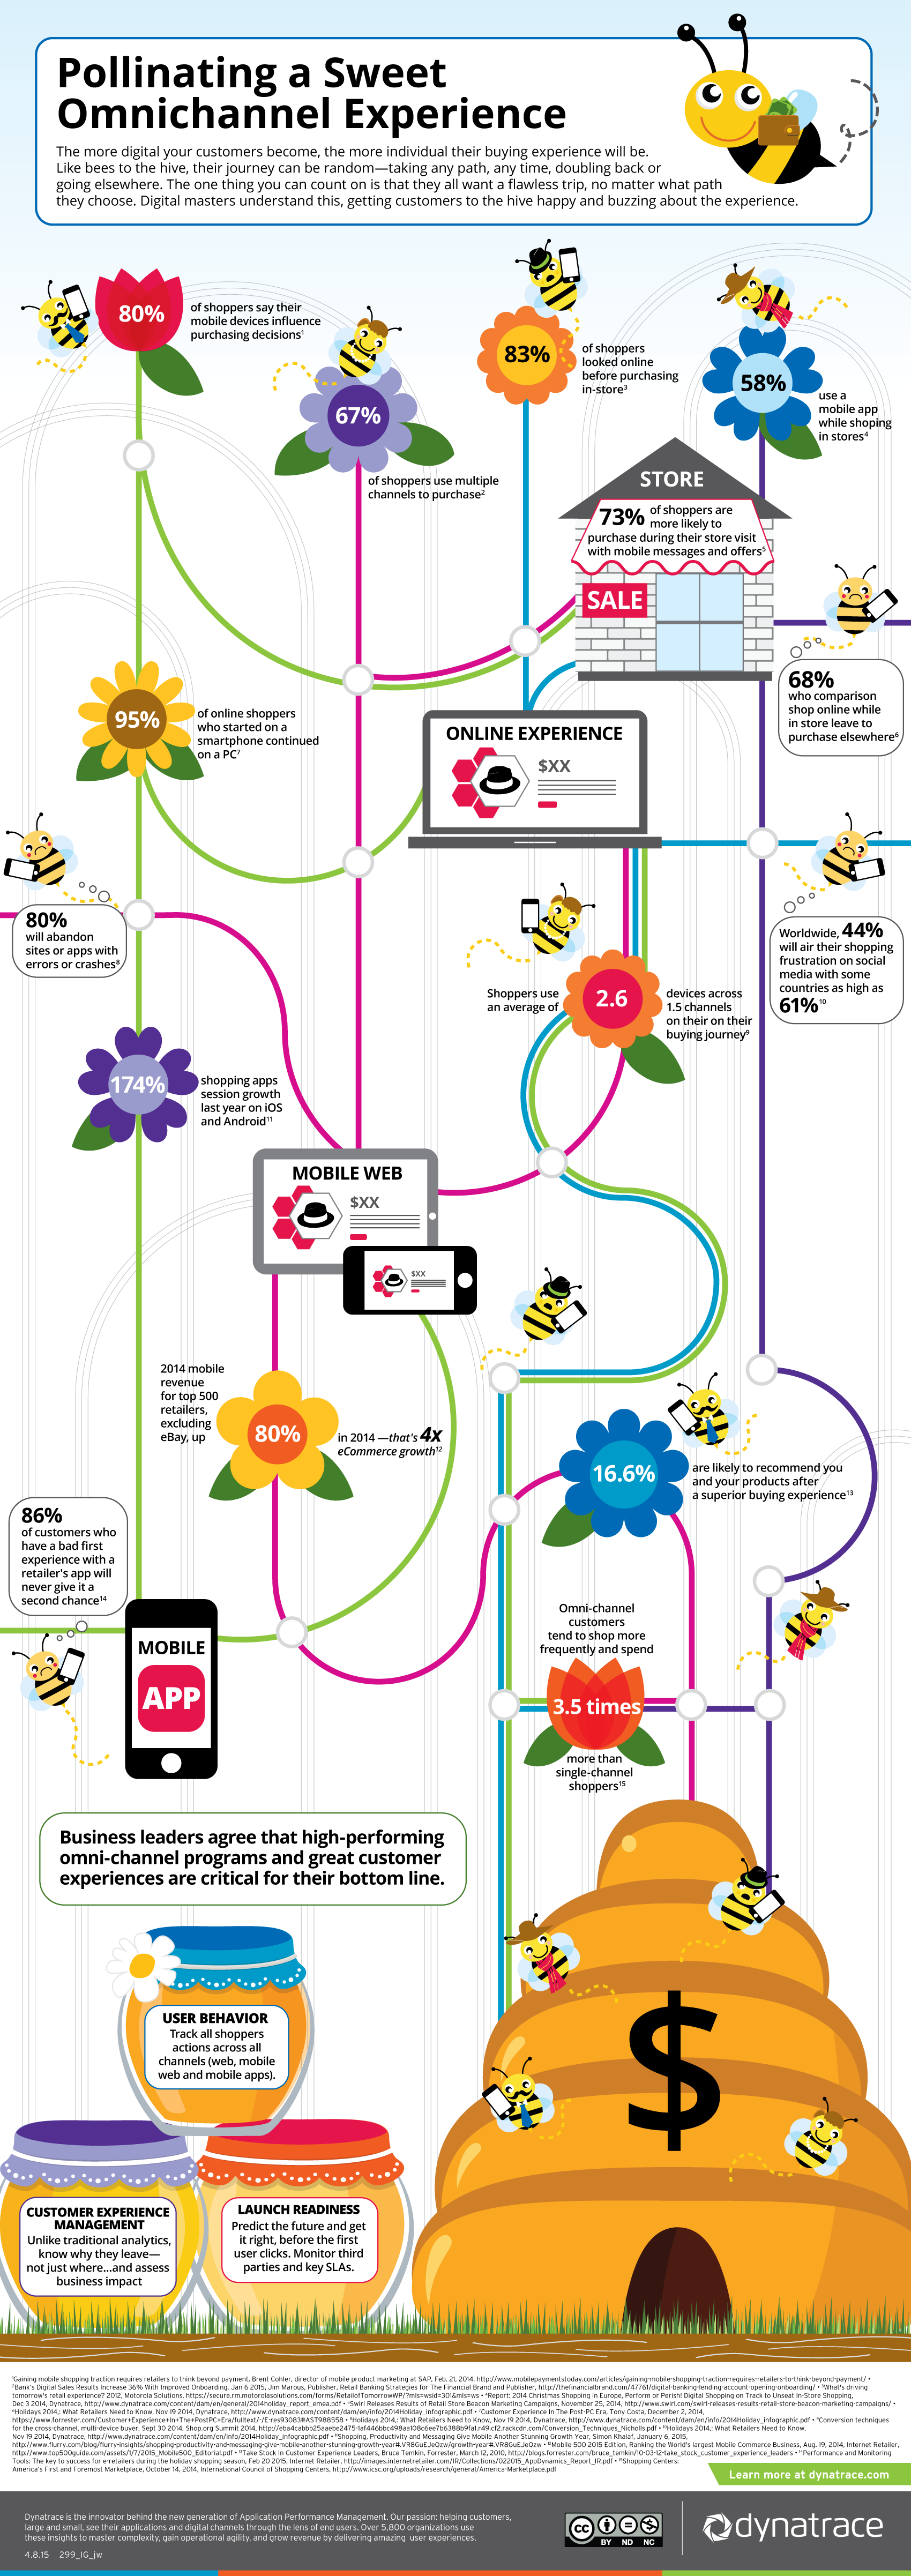
Image of analytics dashboard courtesy of Shutterstock.