 Survey research conducted in the fall of 2010 investigating job satisfaction among usability practitioners and how satisfaction is impacted by employer type, organizational placement, and other factors.
Preface
A couple of things before we begin…
“Usability” vs. “UX” vs. whatever else we call ourselves
Throughout this article, I use the terms “usability” and “UX” interchangeably. I know there are differences and specialization within the general field of usability. This article (and the survey behind it) aims to include the many different types of usability-related work under the general banners of usability and UX. Every survey respondent was presented with this preface:
Please read:
As usability practitioners, we all do a variety of things. “Usability” in this survey is meant to cover that broad range of services and the many different names for them — UX, usability testing, card-sorting, wireframing, etc. — the many ways we bring end-user input and/or expert guidance to a project.
And usability may only be part of your job; your primary responsibility might be as a B.A. or web designer. That’s fine; I want your input about your usability work, too.
Seven-point scales used throughout
Seven-point scales were used for all applicable questions, and to ease analysis higher numbers always indicate positive scenarios. For example, a low numeric score on the question regarding ease-of-funding indicates an environment in which funding is challenging to secure. In short, high numbers indicate desirable situations. Also, the numbers are not meant to be scrutinized for statistical significance. Rather, they indicate the general sentiment of the respondents.
Why Conduct This Survey?
Six years ago, I wrote a paper for Human Factors International (HFI) about my experiences in starting a usability effort within a corporation. The paper was written as HFI was releasing its book, Institutionalization of Usability, which describes the evolution of a usability program from infancy to robust maturity (the point at which usability is routine within an organization). Routine usability is defined as follows:
Usability “has become a routine part of the development organization. It is unthinkable that a project would proceed without usability engineering. The usability practitioners are a fully accepted and well-understood part of the design process.
But after 10 years and having led UX teams at three large corporations, I’ve found that “routine” usability is elusive, perhaps even unachievable. And I’ve grown weary of repeatedly explaining the benefits of usability, bickering over role boundaries with project teams, and battling for funding.
My dream (which I’ve pursued at all three corporations I’ve worked for) is to simply have “Contact Usability Team” as a checkbox on a standard project plan that all projects at least refer to. I’m not imagining that we’d be attached to every single project. Rather, I merely want to be contacted so that we can assess the situation and pursue involvement where sensible and impactful.
I’ve consistently experienced the same problems everywhere I’ve worked:
- No standard project methodologies to put that checkbox on
- People leave and join the company all the time, creating a never-ending need to educate people and generate buy-in
- Non-commerce applications for which ROI is thought to be “softer”
- Lack of pre-measures to enable decent ROI analysis
- Compulsory use of internal applications for which usability is viewed as a luxury
- Vendor/purchased applications for which no customization is desired
My teams have done all the suggested things to market and strengthen the usability presence within the enterprise, but the need to constantly explain and sell remains.
Maybe it’s me?
I was frustrated. I’d been doing this for several years at three companies and hadn’t managed to establish that “routine” usability—not even close. Typically only a small percentage of active projects get usability attention, and a great many things continue to be built and bought with no usability attention. I wondered, is it just me? Maybe I’m simply ineffective at moving a large organization to routine usability.
Hoping that it’s not me, I decided to survey my fellow practitioners on a number of issues, including how routine usability is at different companies, how industry type might impact that routineness, and how those factors might impact the job satisfaction of usability staff.
The key hypotheses I had in mind when embarking on this were:
- Usability has more support and practitioners are happier at companies intently focused on UIs as compared to more “traditional” companies (companies that focus on non-UI products like insurance, financial services, etc.).
- That few, if any, UX practitioners are experiencing a “routine usability” environment.
As the survey evolved, it took shape to investigate a number of other things:
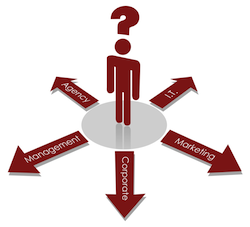
- Who’s happier: “agency” UX staff or “corporate” UX staff?
- Are front-line resources happier than managers?
- Does organizational placement of the UX team impact staff happiness?
- Do years of service lead to burn-out (diminished happiness)?
But the key hypotheses remained. And the answers?
- True… and false.
- True.
UX Staff at “Traditional” Companies Are Happier Than Those at UI-focused Companies
I was very surprised to see this result. I had supposed that companies focused on UIs (e-commerce, software, etc.) would inherently value a strong user experience and therefore strongly support UX endeavors, and therefore UX staff would be happier than their peers at more “traditional” companies. I was wrong… sort of.
A question divided respondents as follows:
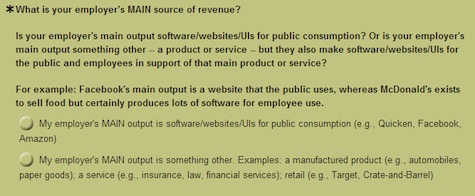
And averaged job-satisfaction scores came back as follows:
|
UI-Focused Respondents
|
Non-UI-Focused Respondents
|
|
|
4.33
|
4.72
|
Let’s look at the overall differences between these two groups.
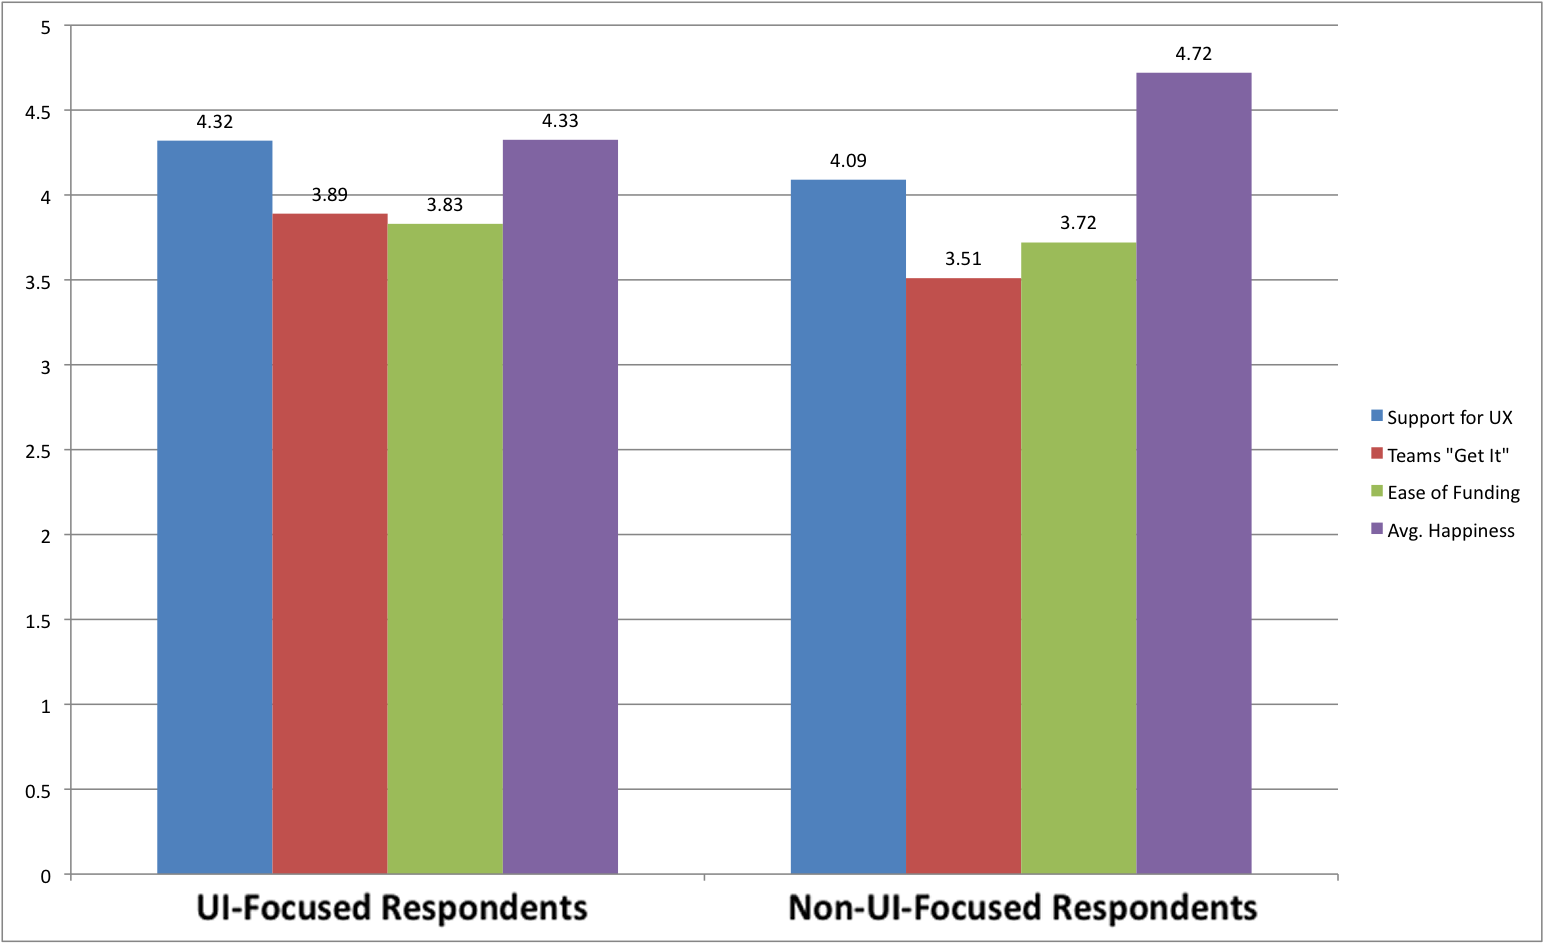
As expected, the UI-focused respondents’ scores regarding support, teams “getting it” (the need to sell/explain), and ease of funding exceeded those of the non-UI-focused respondents. And yet the UI-focused respondents are less satisfied than their peers in more “traditional” companies. Why might that be?
I looked for drivers, filtering by organization placement (IT vs. non-IT) and role type (front-line resource vs. manager) and years of experience. Some possible influences are present.
Among the UI-focused respondents, there is a group who are in more dual-role positions, who have both front-line project responsibilities and people-management responsibilities. As you’ll read later, this group can drag down overall satisfaction ratings.
But the non-UI-focused population has a higher representation of people working within IT. And as you’ll read later, those working in IT report lower happiness.
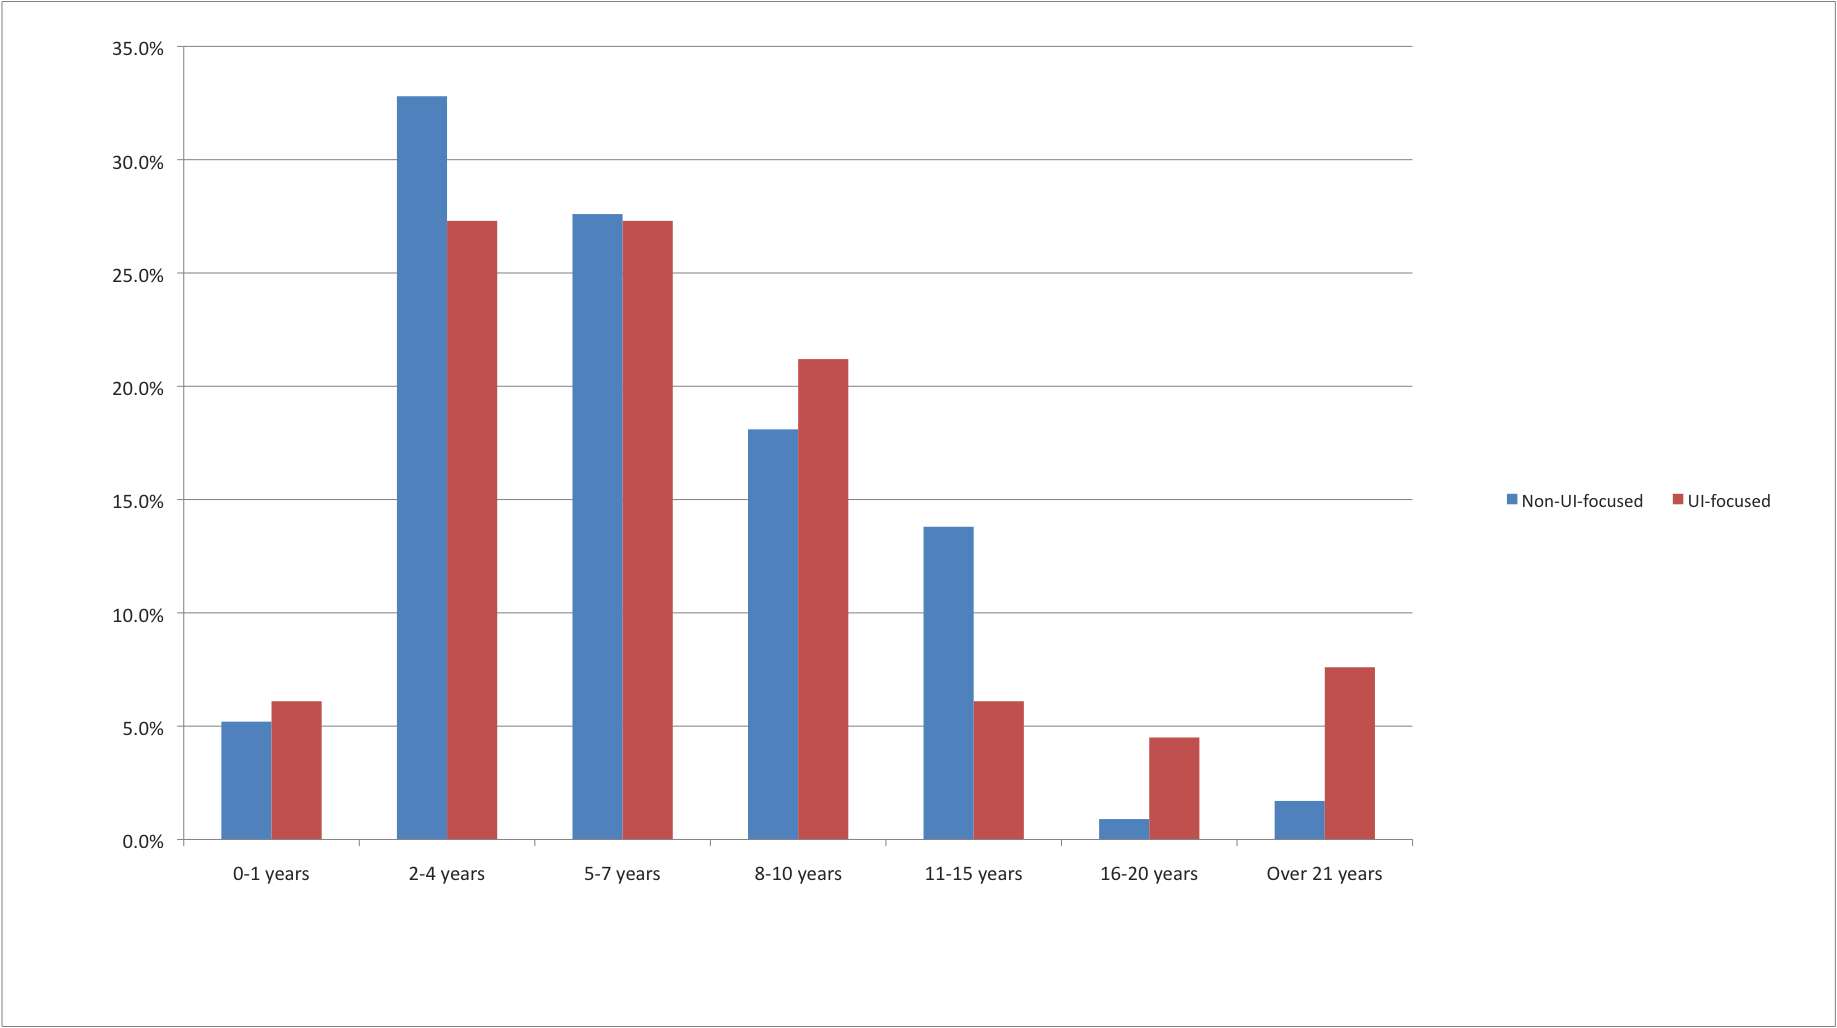
The UI-focused population does include more respondents with over 21 years of experience (see following graph), and as you’ll read later, this group reported a sharp drop in satisfaction.
Perhaps other factors not measured in this survey are in play here. Perhaps the pace of work or UX expectations for UI-focused companies are more demanding, thereby impacting job satisfaction? More study is needed.
Routine Usability Nearly Nonexistent
As described by HFI in the book Institutionalization of Usability, the most mature state for a usability program is:
Level 5: Routine Usability. [Usability] has become a routine part of the development organization. It is unthinkable that a project would proceed without usability engineering. The usability practitioners are a fully accepted and well-understood part of the design process (Schaffer 252).
The survey investigated the prevalence of routine usability work environments by asking the following three questions:
Question 1

Question 2
Question 3
These questions were only asked of the non-agency respondents. This was done for two reasons:
- I was aiming to investigate the existence of “routine” usability environments. This would be accomplished via questions about the employer’s support for usability and the challenges in securing project funding. Since agency resources are (generally) only engaged when a project is already approved, the support and funding questions become significantly less telling.
- I was also investigating the impact on job satisfaction of the type of employer—those focused on UIs vs. those less so. Though agencies may specialize on a particular industry, generally they will take on widely varied work and therefore questions about employer type would become muddled.
Following a strict interpretation of the definition above, “routine usability” should be expressed via highest-possible scores on all three questions:
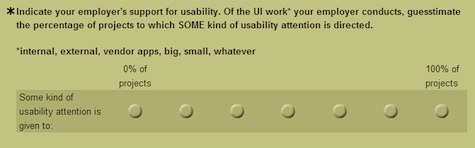
- Indicate your employer’s support for usability. Some kind of usability attention is given to: 100% of projects.
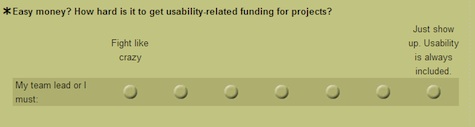
- How hard is it to get usability-related funding for projects? My team lead or I must: Just show up. Usability is always included.
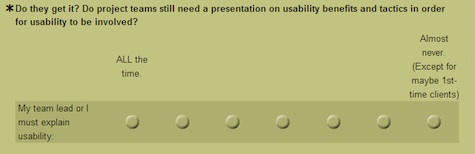
- Do they get it? My team lead or I must explain usability: Almost never. (Except for maybe 1st-time clients)
Of the non-agency respondents:
- 11 of 175 gave question 1 the highest-possible score
- 11 of 170 gave question 2 the highest-possible score
- 13 of 175 gave question 3 the highest possible score
Combine questions 1 and 2, and a mere four respondents surface.
Combine all three questions, and just two respondents surface. And those people:
- Are very happy (average satisfaction ratings of 6).
- Both work outside of IT
- Both work for employers that are UI-focused. This runs counter to the finding that UI-focused employees are less happy than non-UI-focused ones, but this is only two respondents.
So the hypothesis that few, UX practitioners are experiencing a “routine usability” environment appears to be true.
Other Findings
My usability career has been spent entirely as an “inside” resource—a full-time employee of a corporation. My team members and I provided a broad set of UX services to the company: usability research, front-end design, web analytics, etc. Frequently, internal teams are frustrated to find themselves competing with outside agencies for their own employers’ dollars. Sometimes, though, the internal team gets to augment itself with agency staff or help select and manage a larger agency engagement. But for those of us “on the inside,” know this: our agency peers are happier.
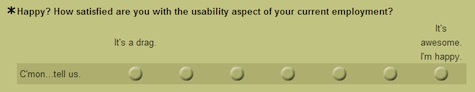
Respondents were first asked about their job satisfaction:
And then categorized via the following question:
Averaged job-satisfaction scores came back as follows:
|
Agency Respondents
|
Non-Agency Respondents
|
|
|
5.23
|
4.56
|
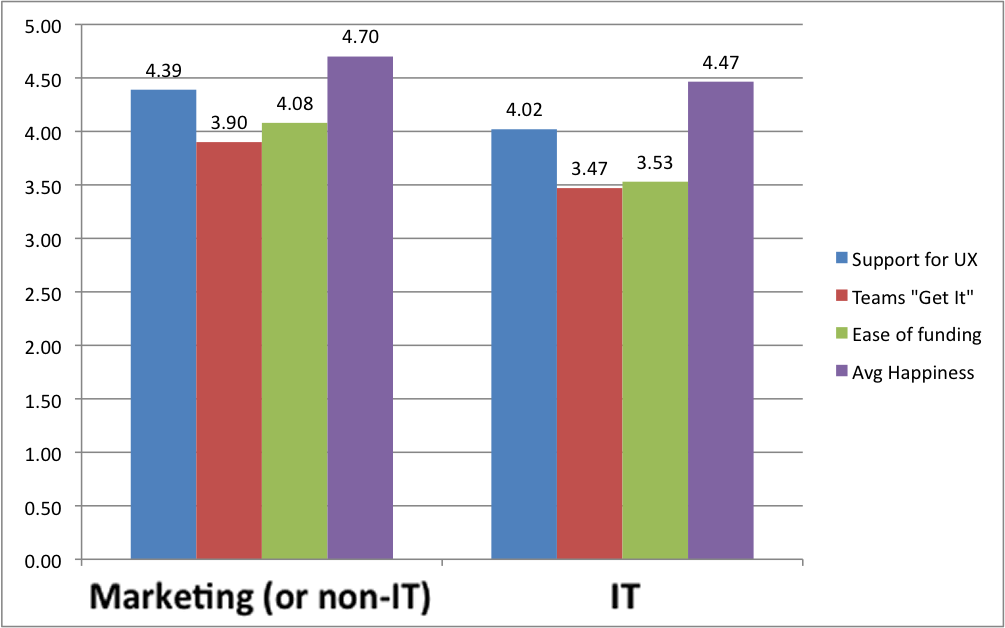
So if you’re not working for an agency, what internal organization might you want to be in?
The organizational placement of a UX team has long been discussed within the industry. And there appears to be no single, best response. Companies approach the organizational placement of their UX groups in a variety of ways.
However, the non-agency respondents indicate that organizations other than IT provide more UX-friendly environments and greater job satisfaction (see the graph below). Perhaps non-IT organizations have more end-user contact and concern. Or perhaps the demands on the IT organization are steeper, thereby impacting job satisfaction.
Thinking about the job drags us down
After the initial four questions, non-agency respondents were asked several more. At the end of the survey, they were again asked about their satisfaction, using the same response scale. My supposition was that after completing a few questions about employer support for usability, the need to explain usability, and fighting for funding, respondents’ satisfaction ratings would drop. This was correct; with rare exception, respondents’ second (or what I call “post”) satisfaction responses were lower than their initial response. So, for non-agency respondents, I use the average of their pre and post ratings.
This factors interestingly in the next measure.
Who’s happier, frontline resources or managers?
All respondents were asked about their role type:
Those who answered “None of the above” were exited from the survey.
Those who are purely managers reported the highest averaged satisfaction. They also show the greatest delta between pre and post satisfaction responses. This suggests that once those managers have been reminded of the trials of the job (selling, fighting for funding, etc.) they greatly reduce their satisfaction ratings.
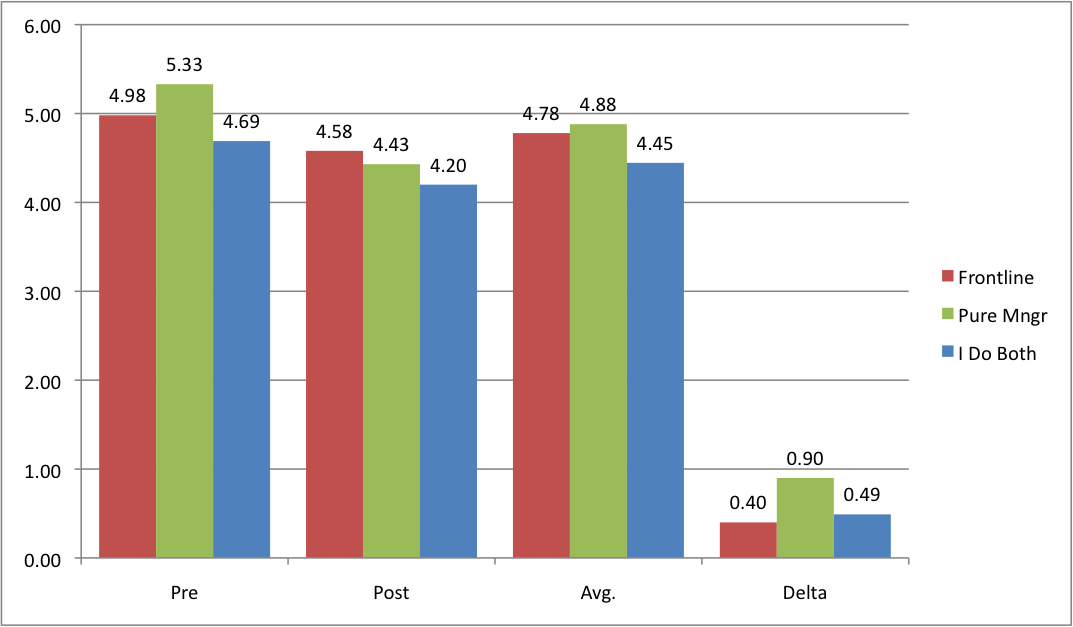
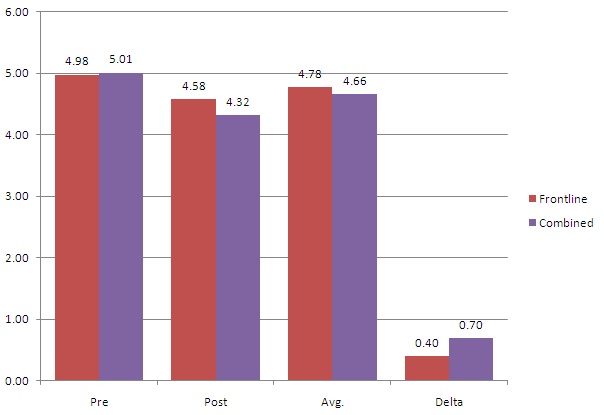
Satisfaction ratings of three different resource types
In the averaged scores, the frontline resource who has no managerial responsibilities is nearly as satisfied as the pure manager. And the frontline resource has the smallest delta between pre and post satisfaction ratings.
The least satisfied (by all measures: pre, post, and averaged) is the “I Do Both” role—that resource that does both frontline work and has managerial responsibilities.
High-Support vs. Low-Support Environment
To investigate the satisfaction impact of high-support and low-support environments, I filtered respondent data by responses to the question about support for usability.
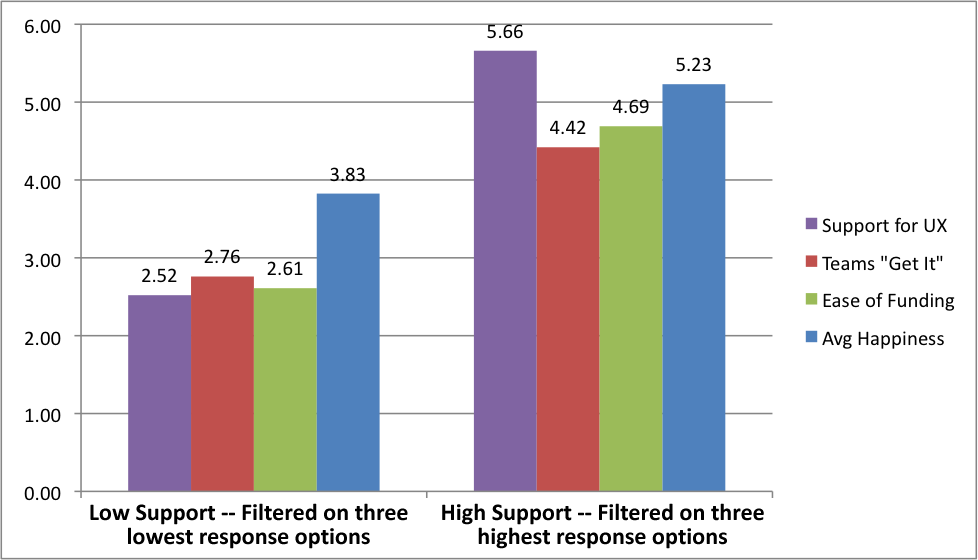
Not surprisingly, a UX-friendly environment makes for happier UX staff. However, an environment that’s not supportive of UX efforts does not proportionately erode the happiness of UX staff. In fact, these respondents seem to report a level of happiness despite an unsupportive environment. Other factors are keeping their spirits up; perhaps they simply enjoy the work, the nature of the tasks, or the mission.
Satisfaction throughout your UX career
It appears that for those practitioners who stay in the industry through their early years there is a long span of increasing job satisfaction. However, the most senior respondents to this survey express a significant drop in job satisfaction.
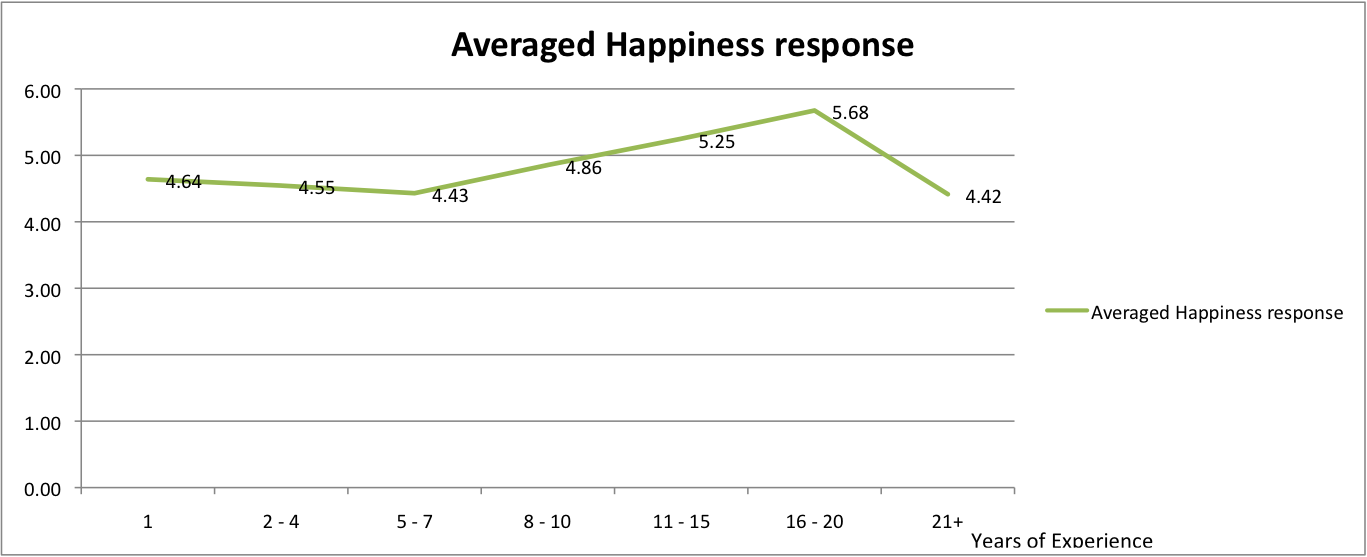
The most senior group does present some factors that may drag down their job-satisfaction ratings:
- The majority are in “I Do Both” dual-role positions, splitting time between people management and project responsibilities.
- The majority work for UI-focused employers.
- They express a low perception of their client/partner teams “getting it” (3.43), meaning there is a frequent need to sell and explain usability.
- They report a difficult funding environment (3.14).
Takeaways, Possible Actions
- A possible upside to the (near) absence of routine usability environments could be that, despite usability being a decades-old practice, there remain plenty of people (clients, management, project teams) who still need convincing, and therefore plenty of potential project work. But one has to set the appropriate expectations; the need to explain and sell usability will not go away, and usability will very rarely be an assumed part of a project’s funding and process. This is a curiously sad upside. It’s akin to doctors being pleased that there are so many exercise-averse people in the world since that creates a patient-rich environment.
- Work for an agency instead of within a large corporate entity. Agency respondents expressed greater satisfaction. However, agency life can come with other downsides; for example, the feast-and-famine cycle of billable work.
- Work outside of IT. Of the non-agency respondents, non-IT respondents reported greater satisfaction. As stated earlier, there is no single, best approach to the organizational placement of UX resources. (This, too, is discussed at length in The Institutionalization of Usability.) In my personal experience, working in IT gives the UX team greater exposure to the myriad technology projects underway at any time, but the IT environment is also more cost-conscious, which makes for more administrative work and can create stress. If considering a job, ask about organizational structure, specifically where your role is located. If already working, perhaps an organizational shake-up is in order. Move your team.
- Work at a “traditional” company whose main products are not UIs. Again, this finding surprised me and would benefit from more study. But based on this survey, UI-focused employers, while providing greater support for UX in general, have less satisfied UX staff.
- Be a frontline resource (or tread very carefully into management). Resources who are purely managers (not conducting project work) expressed the highest satisfaction. However, frontline resources expressed high satisfaction as well, and their ratings were not as negatively impacted by reminders of the trials of the job. Furthermore, when all manager ratings are combined (putting dual-role resources and pure managers together), the satisfaction ratings of the frontline resource come out on top, if only by a small margin.
Satisfaction ratings of frontline resources vs. resources with any managerial responsibilitiesMoving into management is the natural progression of the careers and aspirations of many individuals. And this survey has shown that being purely a manager does indeed provide high job satisfaction. Unfortunately, it’s that middle, dual role—which is a common, necessary step between the front lines and pure management—that can drag people down.
- Investigate the employer. If seeking a UX job or considering a move, shadow people at different employer types and within different organizations. Assess the vibe of the environment and ask about job satisfaction. And ask anyone you interact/interview with about support for UX: “What percentage of projects gets UX attention and how is that ensured?” Note: All of the above is stated absent consideration of salary. Different roles and different environments provide different income potential, and income is, of course, an important factor in one’s choice of employment. When choosing the tiers for the years-of-service question, I used the same tiers as the salary survey conducted by the UPA. I believe it would be very enlightening to merge the topics from this satisfaction survey with the UPA salary survey to assess how employer type and organizational placement might impact income (and the relationship between income and satisfaction).
- For employers: If UX is important to you, assess what you might do to recruit and retain great UX staff.
- What makes the agency environment more satisfying than the non-agency environment?
- What can IT do to make itself as appealing as non-IT environments, or even more so?
- Get staff input to carefully structure your managerial roles to avoid burnout.
Logistics of the Survey
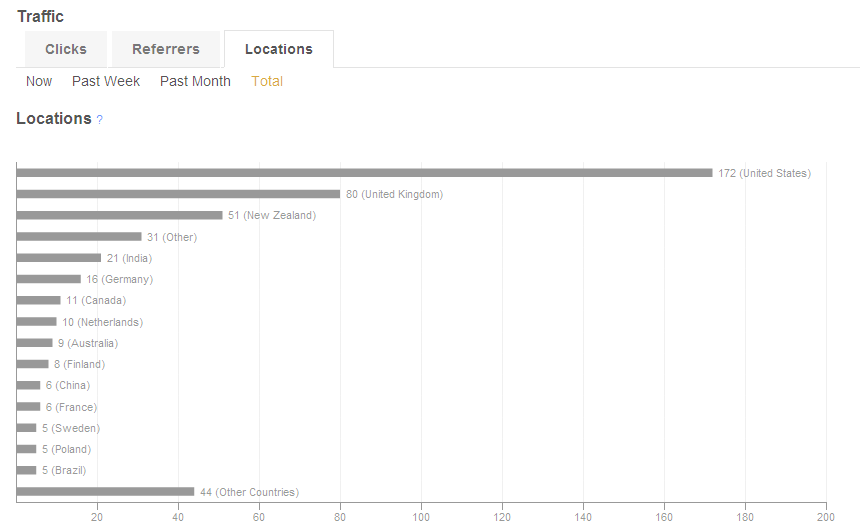
The survey was created using surveymonkey.com and distributed via email, LinkedIn, Twitter, and other usability-related networks. It was completed by 338 individuals from multiple locations around the world. Respondents were not asked to indicate where they reside, however, bit.ly traffic data indicates that the survey was at least visited by individuals from many different world areas. (The survey was of course accessed via other methods as well.)
Related/of Interest
- Institutionalization of Usability: A Step-by-Step Guide, HFI
- The HFI UX Maturity Survey 2009, HFI
- Impediments to a Mature UX Practice: and how to avoid them, HFI
- Usability Professionals’ Association salary surveys
Acknowledgements
Thank you to my St. Louis-area UX colleagues who helped refine the survey and critique this article.
And thank you to Ben Watson for the cover image.