In our last article, we explained the importance of creating value stream maps to capture the customer journey and determine which activities along the way add value.
A bad experience with any of the activities in the value stream can result in a dissatisfied customer and a loss of revenue. The goal, then, is to create a journey that provides maximum value to customers while also being highly efficient and profitable for your business.
As you strive to improve the customer journey, how can you determine the effectiveness of your efforts? One method is through cohort analysis.
What is Cohort Analysis?
Cohort analysis compares the behavior of two or more groups of people. Each group shares an internal characteristic and is referred to as a “cohort.”
Our last article looked at the experience patients have in a doctor’s office. Taking that journey as an example here, we can create cohorts based on the week in which patients visited the doctor. Week one maps to cohort one, week two to cohort two, and so on. In this case, the week the patient visited the doctor would be the cohort’s internal characteristic.
Grouping people into cohorts enables you to look at multiple areas of a business, such as the methods for acquiring, retaining, and generating revenue. It can also give you insights into which customers you should focus on, which channels of communication work best, and which areas need an investment of resources to improve the experience.
Our doctor’s office journey has eight touch points, and we want to see if all of them are improving:
- Patient check-in at the front desk
- Waits to be called for further information
- Called to the front desk to validate personal and insurance information
- Waits to be called again to see the doctor
- Called to go to a room to see the doctor
- Waits for the doctor
- Speaks with the doctor
- Returns to front desk to make a follow up appointment or pay for services
How to Conduct Cohort Analysis
Start by defining your business question. To insure your research will deliver insights, it’s important to spend time defining your business question. It should be based on the objectives of the business and the problems the research will attempt to solve.
In our example we want to know: “Do our improvements reduce the wait time for our patients?” We want to measure the effectiveness of the changes we’ve made and see if customer experience is improving. You may have to iterate and refine the question to ensure it aligns with business objectives.
Define a metric (or set of metrics) that offers insights into your business question. In the above example, time is the key metric that we use to answer our business question. We want to understand how much time a patient spends waiting at each touch point in the journey.
Define your cohorts. Our cohorts are based on the week during which the patients visit the doctor. In other situations you may define your cohorts differently. For example, if you were looking at an e-commerce site you might define your cohorts as customers who purchased within 24 hours of creating an account and customers who did not.
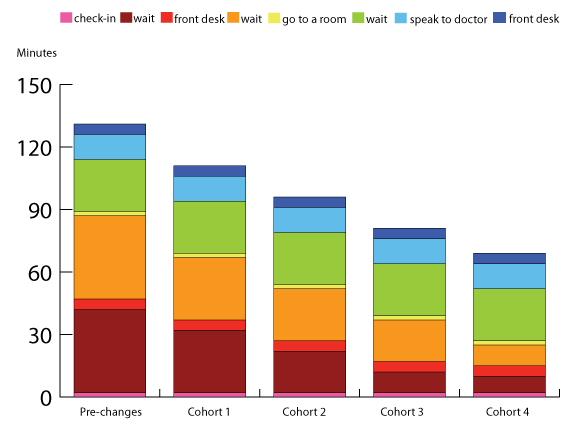
Perform the analysis. In a typical week the doctor sees 100 patients. Each cohort column shows the average amount of time the 100 patients spent at each touch point.
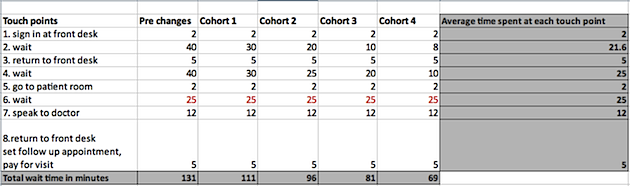
In our data set, prior to making any changes, the total waiting time was 131 minutes which we can take as our baseline to compare other weeks against. By comparing our different cohorts against this baseline, we see a decrease in overall non-value added time by about fifteen minutes a week. It also becomes apparent that the wait time in touch point number six does not decrease. This insight can lead us to perform further investigation into the drivers preventing the decrease.
To gain further insight you might also look at your data through internal and external lenses to understand what could be influencing the changes. For example:
- Your business. Take a look at anything internal that can impact the data. Are staffing levels appropriate? Any there issues with technology breaking down? Is the doctor overbooked?
- The outside world. Take a look at any external forces that could influence business. Do holidays impact the business? Does the economy have influence? Are there any recent events in the media that should be considered?
Benefits
Conducting cohort analysis is another method for breaking down the customer journey to track improvements and gain insights into where the experience breaks down. It gives businesses the tools they need to discover opportunities for improving efficiency and becoming more profitable.
Image of waiting room courtesy Shutterstock