In our previous articles we’ve looked at the experience patients had when visiting the doctors office.
We leveraged value stream maps to design a journey that would have maximum value for customers/patients. The goal was to transform business operations to become more efficient, resulting in reduced business costs and improved patient experience.
We followed that with an article on cohort analysis to gain insight into how the changes from the value stream map improved the experience. In this article, we’re going to use break point analysis to get a snapshot of customer satisfaction levels and establish benchmarks for the experience.
What is Break Point Analysis?
Break point analysis is a way of looking at customer satisfaction data to determine when there are shifts or breaks in satisfaction levels. In the doctor’s office visit example, how long are patients willing to wait while still experiencing a high level of satisfaction? When does a high satisfaction level turn to merely “satisfied” or worse, unhappy? Breakpoint analysis can give insight into a few key questions:
- How satisfied are patients with the current experience?
- When do significant shifts or breaks in satisfaction levels occur?
- What is the distribution of patients across satisfaction levels? (e.g. 40% of customers have high satisfaction)
How To Do It
1. Gather data to determine current service levels
A common way to gauge customer satisfaction with the quality of service is by conducting qualitative surveys. We will be looking at average wait time vs. satisfaction levels:
- Delighted: Would recommend the doctor to family and friends
- Satisfied: Would not recommend but also wouldn’t consider finding a new doctor
- Dissatisfied: Would consider finding a new doctor
2. Analyze and visualize the data
We can plot the average wait time against the patient rating of their experience. This simple visualization technique enables us to find breaks and identify points where the satisfaction levels change significantly.
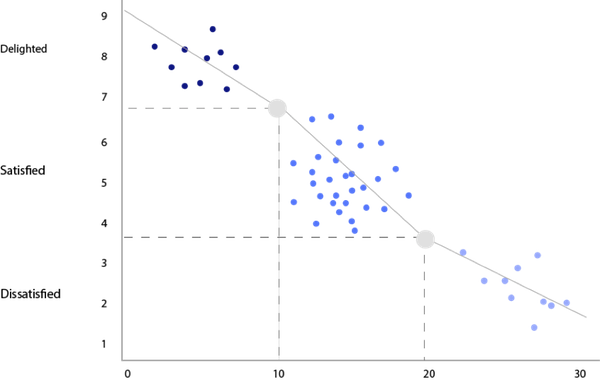
Chart created by Mackenzie Bohannon
In the above chart there are two “breakpoints.” The first occurs at 10 minutes, the second at 20 minutes. At a glance we can see:
- Waiting 10 minutes is the point where patients are delighted
- Patients who wait 10 to 20 minutes are satisfied
- Once patients wait more then 20 minutes they become dissatisfied
- About 20% of patients are dissatisfied and may consider finding a new doctor
Benefits
Break point analysis enables organizations to identify satisfaction levels of customers and reduce over investment. In this simplified example we only considered one aspect of the experience: wait time. To look at the customer experience holistically many other factors would need to be considered.
Conclusion
In summary, break point analysis allows us to:
1. Perform a diagnostic of current customer satisfaction levels: In the above example, we now have a snapshot of how satisfied patients are with their current experience. We can assess the distribution of patients across different satisfaction levels and gauge what waiting times are acceptable to patients. Break point analysis can also serve as an early warning system to identify if we are at risk of losing patients to other practices because of deteriorating service levels.
2. Identify opportunities for investment: Break point analysis plays an invaluable role in identifying improvement opportunities. We can gauge our current performance against customer satisfaction levels and establish a roadmap to our desired service levels. At the same time, break point analysis allows us to identify opportunities for streamlining our investment. In the doctor’s visit example, reducing wait time to less than 10 minutes will not result in significant improvements in customer retention. Hence, the doctor’s practice is probably better off investing in other areas that affect customer satisfaction levels.
3. Know how to invest: By measuring the capital investment needed to improve service levels against the potential increase in customer retention (ROI), the doctor’s practice can make an educated decision on where to invest. For example, they may choose to reduce their staff and keep service levels above the “satisfied breakpoint.” The change will result in savings on staffing with minimal impact on patient satisfaction levels. The savings from reducing the staffing levels can potentially be leveraged to make the patient’s waiting time more comfortable. For example, the doctor’s practice may choose to serve waiting patients snacks or install a coffee machine. These small incremental changes offset the additional waiting time but are far cheaper than ramping up staff levels to reduce wait time.
Image of waiting room courtesy Shutterstock